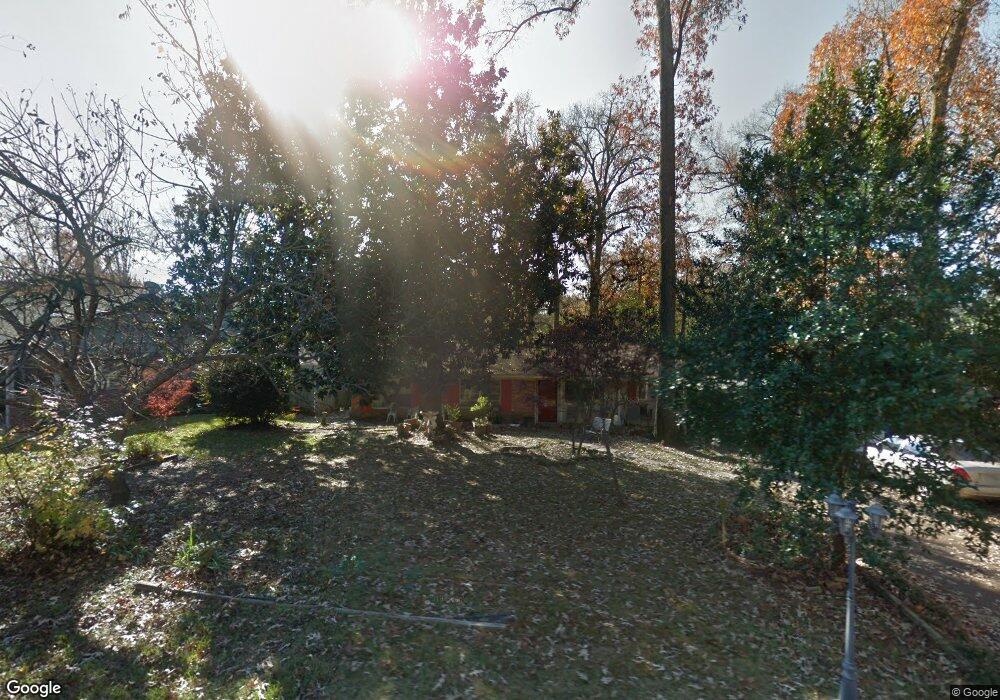
509 Loftin St Tyler, TX 75701
Donnybrook Heights NeighborhoodEstimated Value: $254,446 - $271,000
--
Bed
2
Baths
1,979
Sq Ft
$132/Sq Ft
Est. Value
About This Home
This home is located at 509 Loftin St, Tyler, TX 75701 and is currently estimated at $261,612, approximately $132 per square foot. 509 Loftin St is a home located in Smith County with nearby schools including Woods Elementary School, Hubbard Middle School, and Tyler Legacy High School.
Ownership History
Date
Name
Owned For
Owner Type
Purchase Details
Closed on
Jun 25, 2013
Sold by
Coffey Timothy W and Coffey Tim
Bought by
Skylar Larry D
Current Estimated Value
Home Financials for this Owner
Home Financials are based on the most recent Mortgage that was taken out on this home.
Original Mortgage
$54,500
Outstanding Balance
$25,906
Interest Rate
3.83%
Mortgage Type
Purchase Money Mortgage
Estimated Equity
$235,706
Create a Home Valuation Report for This Property
The Home Valuation Report is an in-depth analysis detailing your home's value as well as a comparison with similar homes in the area
Home Values in the Area
Average Home Value in this Area
Purchase History
| Date | Buyer | Sale Price | Title Company |
|---|---|---|---|
| Skylar Larry D | -- | None Available |
Source: Public Records
Mortgage History
| Date | Status | Borrower | Loan Amount |
|---|---|---|---|
| Open | Skylar Larry D | $54,500 |
Source: Public Records
Tax History Compared to Growth
Tax History
| Year | Tax Paid | Tax Assessment Tax Assessment Total Assessment is a certain percentage of the fair market value that is determined by local assessors to be the total taxable value of land and additions on the property. | Land | Improvement |
|---|---|---|---|---|
| 2025 | $416 | $292,158 | $60,765 | $231,393 |
| 2024 | $416 | $144,788 | $18,525 | $235,627 |
| 2023 | $2,294 | $247,303 | $18,525 | $228,778 |
| 2022 | $2,344 | $202,830 | $16,919 | $185,911 |
| 2021 | $2,282 | $108,781 | $16,919 | $91,862 |
| 2020 | $2,303 | $107,604 | $16,919 | $90,685 |
| 2019 | $2,264 | $103,514 | $16,919 | $86,595 |
| 2018 | $2,052 | $94,364 | $12,350 | $82,014 |
| 2017 | $2,015 | $94,364 | $12,350 | $82,014 |
| 2016 | $2,139 | $100,196 | $12,350 | $87,846 |
| 2015 | $931 | $95,567 | $12,350 | $83,217 |
| 2014 | $931 | $92,726 | $12,350 | $80,376 |
Source: Public Records
Map
Nearby Homes
- 317 Amberwood Cir
- 2319 Pollard Dr
- 611 E Watkins St
- 2108 S Wall Ave
- 1102 S Peach Ave S
- 515 & 517 Charnwood St
- 3922 & 3928 McDonald Rd
- 904 E Dulse St
- 2026 S Wall Ave
- 2110 Belmont Dr
- 2521 Pounds Ave
- 315 Ridgecrest Dr
- 2835 S Broadway Ave
- 2736 Old Bullard Rd
- 905 E Watkins St
- 121 Fair Ln
- 2431 Homestead Ln
- 309 Glenhaven Dr
- 2315 Homestead Ln
- 1931 S Wiley Ave
- 507 Loftin St
- 2613 New Copeland Rd
- 2605 New Copeland Rd
- 508 Loftin St
- 2621 New Copeland Rd
- 423 Loftin St
- 2519 Copeland Rd
- 2519 New Copeland Rd
- 2519 2519 Copeland Rd
- 2606 New Copeland Rd
- 415 Loftin St
- 430 Wilma St
- 2631 New Copeland Rd
- 2614 New Copeland Rd
- 420 Loftin St
- 420 Wilma St
- 2520 New Copeland Rd
- 414 Loftin St
- 2624 2624 New Copeland
- 2624 New Copeland Rd