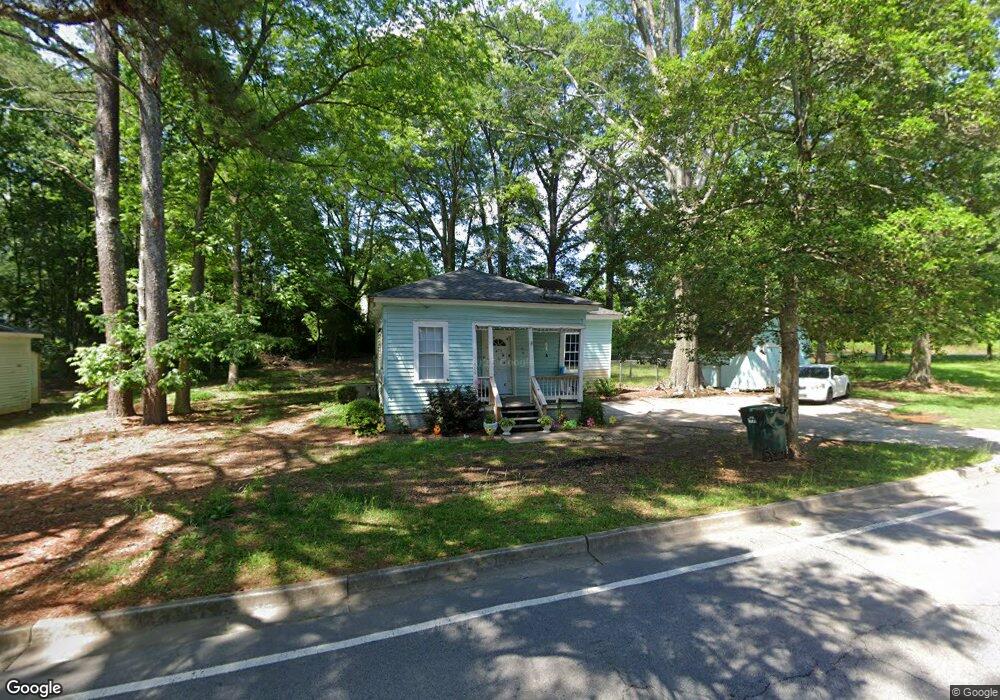
509 Lovvorn Rd Carrollton, GA 30117
Estimated Value: $103,000 - $116,000
2
Beds
1
Bath
824
Sq Ft
$132/Sq Ft
Est. Value
About This Home
This home is located at 509 Lovvorn Rd, Carrollton, GA 30117 and is currently estimated at $108,905, approximately $132 per square foot. 509 Lovvorn Rd is a home located in Carroll County with nearby schools including Carrollton Elementary School, Carrollton Upper Elementary School, and Carrollton Middle School.
Ownership History
Date
Name
Owned For
Owner Type
Purchase Details
Closed on
May 21, 2025
Sold by
Couch James H
Bought by
Beach Kimberly C
Current Estimated Value
Home Financials for this Owner
Home Financials are based on the most recent Mortgage that was taken out on this home.
Original Mortgage
$82,500
Outstanding Balance
$82,217
Interest Rate
6.81%
Mortgage Type
New Conventional
Estimated Equity
$26,688
Purchase Details
Closed on
Aug 10, 2015
Sold by
Couch James H
Bought by
Couch James H and Couch Laura E
Purchase Details
Closed on
Jul 1, 2005
Sold by
Farish Richard W
Bought by
Couch James H
Purchase Details
Closed on
Jun 30, 2005
Sold by
Smitmor Properties Llc
Bought by
Farish Richard W
Purchase Details
Closed on
Nov 27, 2002
Sold by
Norris Matt
Bought by
Smitmor Properties Llc
Purchase Details
Closed on
Sep 23, 2002
Sold by
Citifinancial Mortgage Co Inc
Bought by
Norris Matt
Purchase Details
Closed on
May 7, 2002
Sold by
Rowe Angela
Bought by
Citifinancial Mortgage Co Inc
Purchase Details
Closed on
Jul 11, 1998
Sold by
Miles Harold
Bought by
Rowe Angela
Purchase Details
Closed on
Oct 29, 1996
Sold by
Holmes
Bought by
Miles Harold
Purchase Details
Closed on
Jan 1, 1991
Bought by
Holmes
Create a Home Valuation Report for This Property
The Home Valuation Report is an in-depth analysis detailing your home's value as well as a comparison with similar homes in the area
Home Values in the Area
Average Home Value in this Area
Purchase History
| Date | Buyer | Sale Price | Title Company |
|---|---|---|---|
| Beach Kimberly C | $110,000 | -- | |
| Couch James H | -- | -- | |
| Couch James H | $39,900 | -- | |
| Farish Richard W | $27,500 | -- | |
| Smitmor Properties Llc | -- | -- | |
| Norris Matt | $27,000 | -- | |
| Citifinancial Mortgage Co Inc | $30,800 | -- | |
| Rowe Angela | -- | -- | |
| Miles Harold | $10,000 | -- | |
| Holmes | -- | -- |
Source: Public Records
Mortgage History
| Date | Status | Borrower | Loan Amount |
|---|---|---|---|
| Open | Beach Kimberly C | $82,500 |
Source: Public Records
Tax History Compared to Growth
Tax History
| Year | Tax Paid | Tax Assessment Tax Assessment Total Assessment is a certain percentage of the fair market value that is determined by local assessors to be the total taxable value of land and additions on the property. | Land | Improvement |
|---|---|---|---|---|
| 2024 | $606 | $22,170 | $6,035 | $16,135 |
| 2023 | $606 | $20,821 | $6,036 | $14,785 |
| 2022 | $464 | $15,892 | $4,034 | $11,858 |
| 2021 | $389 | $13,313 | $2,988 | $10,325 |
| 2020 | $356 | $12,186 | $2,988 | $9,198 |
| 2019 | $348 | $11,800 | $2,988 | $8,812 |
| 2018 | $334 | $11,155 | $2,988 | $8,167 |
| 2017 | $336 | $11,155 | $2,988 | $8,167 |
| 2016 | $337 | $11,155 | $2,988 | $8,167 |
| 2015 | $426 | $13,796 | $3,416 | $10,380 |
| 2014 | $428 | $13,796 | $3,416 | $10,380 |
Source: Public Records
Map
Nearby Homes