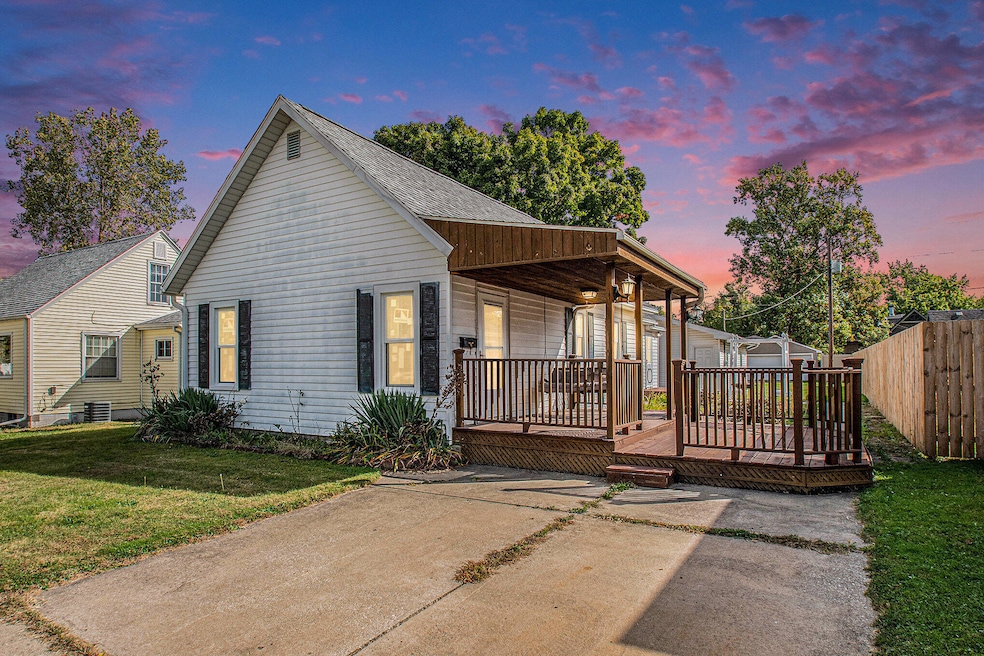


509 Magnolia St Three Oaks, MI 49128
Estimated payment $1,043/month
Highlights
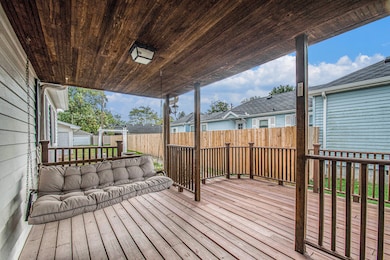
- Deck
- No HOA
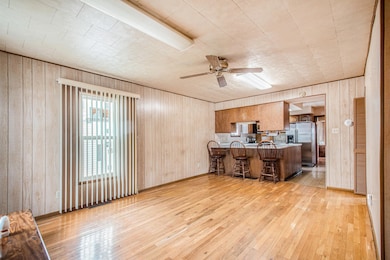
- Living Room
- Wood Flooring
- Porch
- Garden
About This Home
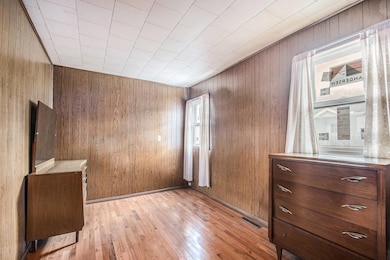
Don't miss out on this rare opportunity! This well-maintained 2-bedroom, 1-bath home offers many updates, strong bones, and is priced just right. Features include a double-car garage, a welcoming front porch, and space for you own garden retreat.
Listing Agent
@properties Christie's International R.E. License #6501427597 Listed on: 10/10/2025

Home Details
Home Type
- Single Family
Est. Annual Taxes
- $1,463
Year Built
- Built in 1915
Lot Details
- 7,129 Sq Ft Lot
- Lot Dimensions are 54x132
- Garden
Parking
- 2 Car Garage
- Garage Door Opener
Home Design
- Composition Roof
- Vinyl Siding
Interior Spaces
- 814 Sq Ft Home
- 1-Story Property
- Ceiling Fan
- Living Room
- Dining Area
- Wood Flooring
- Crawl Space
Kitchen
- Oven
- Range
- Microwave
Bedrooms and Bathrooms
- 2 Main Level Bedrooms
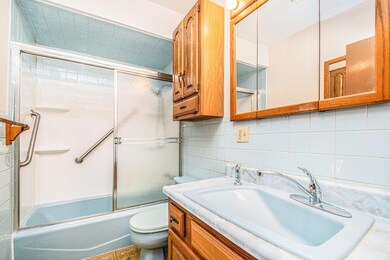
- 1 Full Bathroom
Laundry
- Laundry on main level
- Dryer
- Washer
Outdoor Features
- Deck
- Porch
Utilities
- Forced Air Heating and Cooling System
- Heating System Uses Natural Gas
- Electric Water Heater
Community Details
- No Home Owners Association
Map
Home Values in the Area
Average Home Value in this Area
Tax History
| Year | Tax Paid | Tax Assessment Tax Assessment Total Assessment is a certain percentage of the fair market value that is determined by local assessors to be the total taxable value of land and additions on the property. | Land | Improvement |
|---|---|---|---|---|
| 2025 | $851 | $86,400 | $0 | $0 |
| 2024 | $1,025 | $79,800 | $0 | $0 |
| 2023 | $976 | $79,500 | $0 | $0 |
| 2022 | $938 | $63,000 | $0 | $0 |
| 2021 | $1,317 | $57,800 | $9,600 | $48,200 |
| 2020 | $1,237 | $43,600 | $0 | $0 |
| 2019 | $1,173 | $33,900 | $6,700 | $27,200 |
| 2018 | $1,243 | $33,900 | $0 | $0 |
| 2017 | $1,128 | $34,019 | $0 | $0 |
| 2016 | $1,109 | $30,926 | $0 | $0 |
| 2015 | $1,107 | $31,234 | $0 | $0 |
| 2014 | $327 | $30,049 | $0 | $0 |
Property History
| Date | Event | Price | List to Sale | Price per Sq Ft |
|---|---|---|---|---|
| 10/10/2025 10/10/25 | For Sale | $175,000 | -- | $215 / Sq Ft |
Purchase History
| Date | Type | Sale Price | Title Company |
|---|---|---|---|
| Interfamily Deed Transfer | -- | None Available | |
| Interfamily Deed Transfer | -- | None Available | |
| Quit Claim Deed | -- | None Available |
Source: MichRIC
MLS Number: 25052175
APN: 11-47-7260-0007-01-0
Disclaimer: Certain information contained herein is derived from information provided by parties other than Homes.com. All information provided is deemed reliable, but is not guaranteed to be accurate and should be independently verified.
![]() Information is deemed reliable but not guaranteed.
Information is deemed reliable but not guaranteed.
Copyright 2025 MichRIC, LLC. All rights reserved.
- 18312 Avery Rd
- 4152 Sawyer Rd
- 220 Chapman Rd
- 6271 N 525 W
- 207 Westwood Dr
- 1980 Park St
- 1982 Park St
- 106 Warsaw St Unit 106 Warsaw Unit 2
- 1000 Long Beach Ln
- 190 Country Club Dr Unit ID1328968P
- 523 Grove St
- 207 New York St
- 1 Court Blvd
- 515 Cecil St
- 513 Pine Lake Ave Unit ID1328978P
- 402 Truesdell Ave
- 909 Jackson St Unit 3
- 1101 Woodward St Unit 3
- 201 Weller Ave Unit ID1328986P
- 807 Rose St Unit 807 1/2 Rose