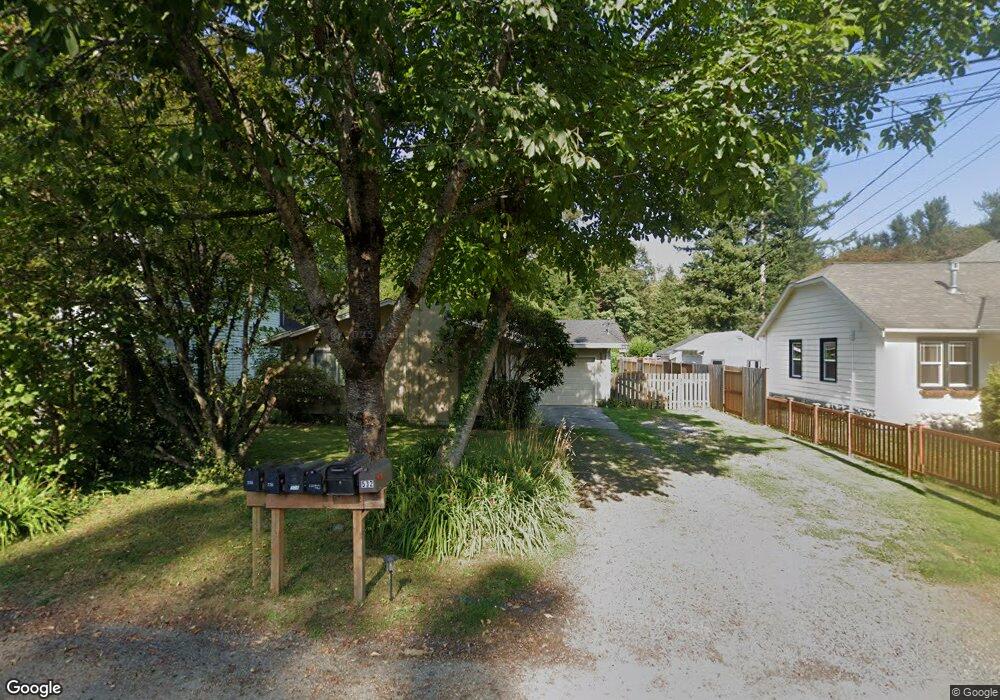
509 Main Ave N North Bend, WA 98045
Estimated Value: $598,415 - $779,000
3
Beds
1
Bath
960
Sq Ft
$707/Sq Ft
Est. Value
About This Home
This home is located at 509 Main Ave N, North Bend, WA 98045 and is currently estimated at $678,604, approximately $706 per square foot. 509 Main Ave N is a home located in King County with nearby schools including North Bend Elementary School, Twin Falls Middle School, and Mount Si High School.
Ownership History
Date
Name
Owned For
Owner Type
Purchase Details
Closed on
Aug 22, 2011
Sold by
Scott Charles E
Bought by
Scott Charles E and Scott Maria Angelica
Current Estimated Value
Purchase Details
Closed on
Mar 26, 1994
Sold by
Christensen Robert J and Christensen Sarah F
Bought by
Scott Irene
Home Financials for this Owner
Home Financials are based on the most recent Mortgage that was taken out on this home.
Original Mortgage
$55,000
Interest Rate
7.15%
Purchase Details
Closed on
Jul 23, 1993
Sold by
Wolfe William A and Wolfe Sandra K
Bought by
Christensen Robert J and Christensen Sarah
Create a Home Valuation Report for This Property
The Home Valuation Report is an in-depth analysis detailing your home's value as well as a comparison with similar homes in the area
Home Values in the Area
Average Home Value in this Area
Purchase History
| Date | Buyer | Sale Price | Title Company |
|---|---|---|---|
| Scott Charles E | -- | None Available | |
| Scott Charles E | -- | None Available | |
| Scott Irene | -- | First American Title | |
| Christensen Robert J | $110,000 | -- |
Source: Public Records
Mortgage History
| Date | Status | Borrower | Loan Amount |
|---|---|---|---|
| Closed | Scott Irene | $55,000 |
Source: Public Records
Tax History Compared to Growth
Tax History
| Year | Tax Paid | Tax Assessment Tax Assessment Total Assessment is a certain percentage of the fair market value that is determined by local assessors to be the total taxable value of land and additions on the property. | Land | Improvement |
|---|---|---|---|---|
| 2024 | $4,800 | $517,000 | $284,000 | $233,000 |
| 2023 | $4,404 | $460,000 | $258,000 | $202,000 |
| 2022 | $4,304 | $511,000 | $296,000 | $215,000 |
| 2021 | $3,994 | $397,000 | $225,000 | $172,000 |
| 2020 | $3,736 | $334,000 | $190,000 | $144,000 |
| 2018 | $3,475 | $290,000 | $161,000 | $129,000 |
| 2017 | $2,855 | $281,000 | $155,000 | $126,000 |
| 2016 | $2,700 | $238,000 | $136,000 | $102,000 |
| 2015 | $2,440 | $215,000 | $121,000 | $94,000 |
| 2014 | -- | $210,000 | $119,000 | $91,000 |
| 2013 | -- | $175,000 | $92,000 | $83,000 |
Source: Public Records
Map
Nearby Homes
- 369 E Park St Unit D3
- 41243 SE 123rd St
- 690 SE 11th Place
- 690 SE 11th Place Unit 8
- 751 SE 11th St
- 1094 SE 10th St
- 716 SE 11th Place
- 716 SE 11th Place Unit 7
- Martin Plan at Harrison Court
- Savannah Plan at Harrison Court
- Caslon Plan at Harrison Court
- Legacy Plan at Harrison Court
- Bridgewater Plan at Harrison Court
- Stafford Plan at Harrison Court
- 639 SE 11th Place
- 639 SE 11th Place Unit 55
- 1065 SW 12th St
- 1118 Swiftwater Way SE Unit Lot 35
- 1117 Swiftwater Way SE
- 1117 Swiftwater Way SE Unit 42