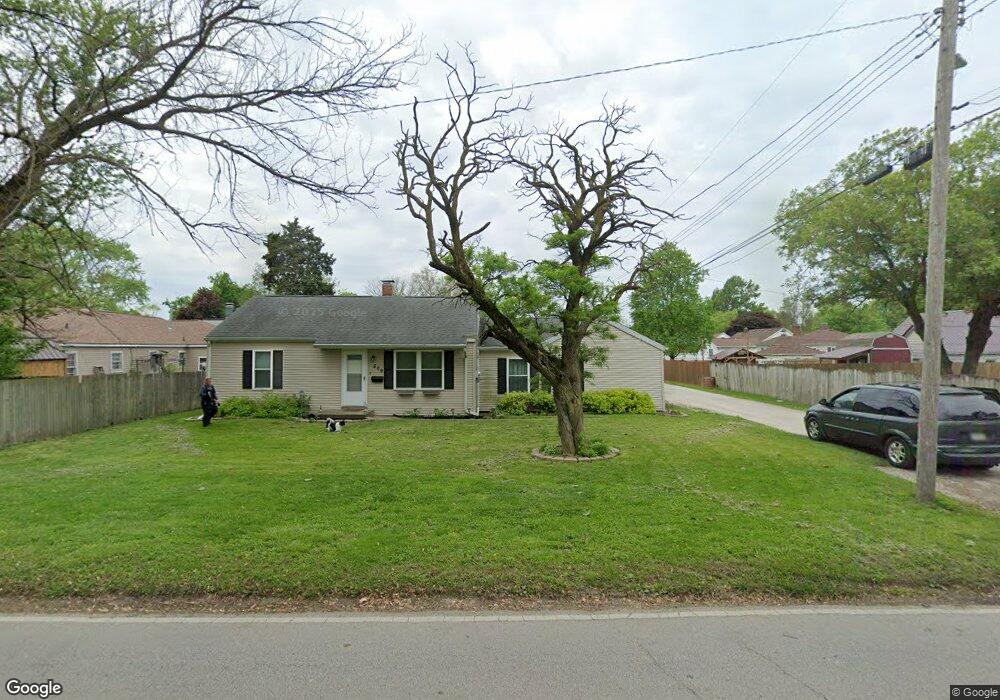
509 N 33rd St Mattoon, IL 61938
Estimated Value: $91,499 - $130,000
3
Beds
2
Baths
1,248
Sq Ft
$88/Sq Ft
Est. Value
About This Home
This home is located at 509 N 33rd St, Mattoon, IL 61938 and is currently estimated at $110,125, approximately $88 per square foot. 509 N 33rd St is a home located in Coles County with nearby schools including Mattoon High School, St Mary School, and St. John's Lutheran School.
Ownership History
Date
Name
Owned For
Owner Type
Purchase Details
Closed on
Jun 6, 2018
Sold by
Finney Rodney L and Finney Julie A
Bought by
Haycraft Ronnie
Current Estimated Value
Home Financials for this Owner
Home Financials are based on the most recent Mortgage that was taken out on this home.
Original Mortgage
$84,848
Outstanding Balance
$73,379
Interest Rate
4.5%
Mortgage Type
New Conventional
Estimated Equity
$36,746
Purchase Details
Closed on
Jan 30, 2014
Sold by
Fannie Mae
Bought by
Finney Rodney L and Finney Julie A
Home Financials for this Owner
Home Financials are based on the most recent Mortgage that was taken out on this home.
Original Mortgage
$40,090
Interest Rate
5.25%
Mortgage Type
New Conventional
Purchase Details
Closed on
Sep 26, 2013
Sold by
Coles County Judge
Bought by
Federal National Mortgage Association
Purchase Details
Closed on
Sep 7, 2007
Sold by
Jenkins Elna J
Bought by
Auth Evelyn L and Sapp James
Home Financials for this Owner
Home Financials are based on the most recent Mortgage that was taken out on this home.
Original Mortgage
$42,750
Interest Rate
6.63%
Mortgage Type
New Conventional
Create a Home Valuation Report for This Property
The Home Valuation Report is an in-depth analysis detailing your home's value as well as a comparison with similar homes in the area
Home Values in the Area
Average Home Value in this Area
Purchase History
| Date | Buyer | Sale Price | Title Company |
|---|---|---|---|
| Haycraft Ronnie | $83,000 | None Available | |
| Finney Rodney L | $25,500 | -- | |
| Federal National Mortgage Association | -- | -- | |
| Auth Evelyn L | $45,000 | None Available |
Source: Public Records
Mortgage History
| Date | Status | Borrower | Loan Amount |
|---|---|---|---|
| Open | Haycraft Ronnie | $84,848 | |
| Previous Owner | Finney Rodney L | $40,090 | |
| Previous Owner | Auth Evelyn L | $42,750 |
Source: Public Records
Tax History
| Year | Tax Paid | Tax Assessment Tax Assessment Total Assessment is a certain percentage of the fair market value that is determined by local assessors to be the total taxable value of land and additions on the property. | Land | Improvement |
|---|---|---|---|---|
| 2024 | $1,443 | $22,923 | $4,118 | $18,805 |
| 2023 | $1,240 | $20,467 | $3,677 | $16,790 |
| 2022 | $1,240 | $20,129 | $3,616 | $16,513 |
| 2021 | $1,223 | $18,489 | $3,321 | $15,168 |
| 2020 | $1,204 | $19,157 | $3,441 | $15,716 |
| 2019 | $1,724 | $18,489 | $3,321 | $15,168 |
| 2018 | $1,693 | $18,489 | $3,321 | $15,168 |
| 2017 | $1,688 | $18,489 | $3,321 | $15,168 |
| 2016 | $1,652 | $18,489 | $3,321 | $15,168 |
| 2015 | $1,100 | $18,489 | $3,321 | $15,168 |
| 2014 | $1,100 | $18,489 | $3,321 | $15,168 |
| 2013 | $1,100 | $18,489 | $3,321 | $15,168 |
Source: Public Records
Map
Nearby Homes
- 3020 Champaign Ave
- 2800 Shelby Ave
- 1104 N 32nd St
- 3433 Western Ave
- 2720 Champaign Ave
- 1117 N 32nd St
- 2617 Richmond Ave
- 2800 Pine Ave
- 7 Noyes Ct
- 109 N 26th St
- 420 Park St
- 2413 Moultrie Ave
- 2516 Pine Ave
- 113 S 25th St
- 2505 Pine Ave
- 2502 Pine Ave
- 2317 Shelby Ave
- 3816 Western Ave
- 2305 Shelby Ave
- 713 N 23rd St
- 3308 Shelby Ave
- 3300 Shelby Ave
- 3301 Moultrie Ave
- 3312 Shelby Ave
- 3232 Shelby Ave
- 3305 Moultrie Ave
- 3309 Moultrie Ave
- 3228 Shelby Ave
- 3316 Shelby Ave
- 3233 Moultrie Ave
- 3315 Moultrie Ave
- 3229 Moultrie Ave
- 3224 Shelby Ave
- 3320 Shelby Ave
- 3225 Moultrie Ave
- 3301 Shelby Ave
- 3305 Shelby Ave
- 3309 Shelby Ave
- 3220 Shelby Ave
- 3313 Shelby Ave
Your Personal Tour Guide
Ask me questions while you tour the home.