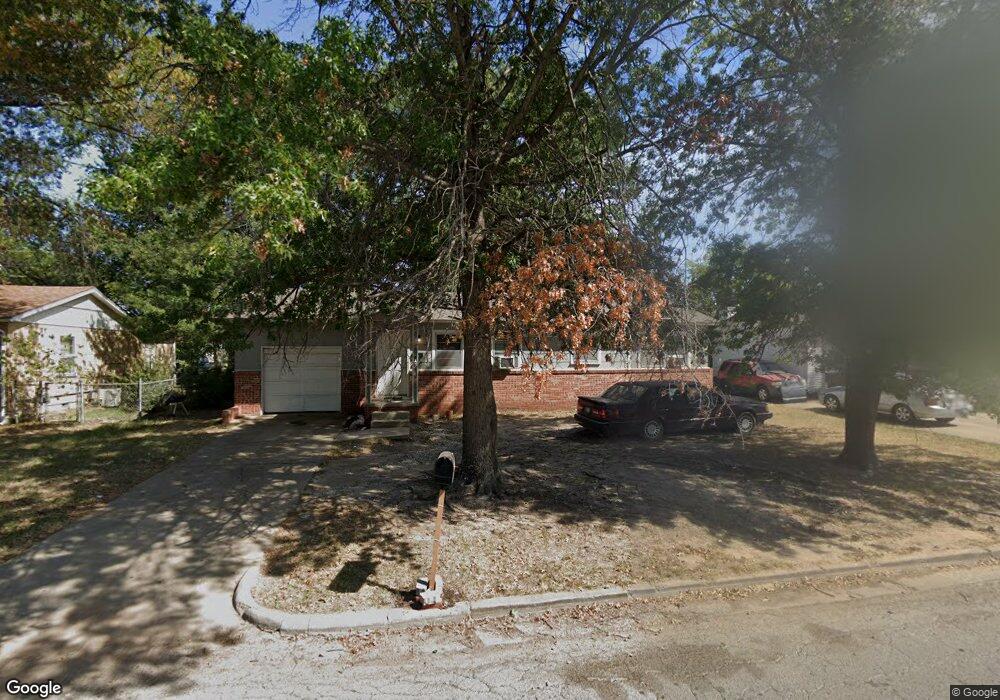
509 N Clearcrest Ave Okmulgee, OK 74447
Estimated Value: $48,000 - $78,000
3
Beds
1
Bath
912
Sq Ft
$69/Sq Ft
Est. Value
About This Home
This home is located at 509 N Clearcrest Ave, Okmulgee, OK 74447 and is currently estimated at $63,315, approximately $69 per square foot. 509 N Clearcrest Ave is a home located in Okmulgee County with nearby schools including Okmulgee Primary School, Dunbar Elementary School, and Okmulgee Middle School.
Ownership History
Date
Name
Owned For
Owner Type
Purchase Details
Closed on
Jan 18, 2022
Sold by
Smith Scott D and Smith Cindy C
Bought by
Kismet Holdings Llc
Current Estimated Value
Home Financials for this Owner
Home Financials are based on the most recent Mortgage that was taken out on this home.
Original Mortgage
$41,000
Interest Rate
1%
Mortgage Type
Construction
Purchase Details
Closed on
Jun 1, 2012
Sold by
Clark William K and Clark Comstance J
Bought by
Smith Scott D and Smith Cindy C
Purchase Details
Closed on
Apr 1, 1995
Sold by
Wm Clark
Bought by
Alvin Slate
Purchase Details
Closed on
Apr 19, 1994
Sold by
Russell Stowers Etal
Bought by
William K Clark
Create a Home Valuation Report for This Property
The Home Valuation Report is an in-depth analysis detailing your home's value as well as a comparison with similar homes in the area
Home Values in the Area
Average Home Value in this Area
Purchase History
| Date | Buyer | Sale Price | Title Company |
|---|---|---|---|
| Kismet Holdings Llc | $39,000 | Colonial Title | |
| Smith Scott D | -- | None Available | |
| Alvin Slate | $146,000 | -- | |
| William K Clark | $35,000 | -- |
Source: Public Records
Mortgage History
| Date | Status | Borrower | Loan Amount |
|---|---|---|---|
| Previous Owner | Kismet Holdings Llc | $41,000 | |
| Closed | Smith Scott D | $0 |
Source: Public Records
Tax History Compared to Growth
Tax History
| Year | Tax Paid | Tax Assessment Tax Assessment Total Assessment is a certain percentage of the fair market value that is determined by local assessors to be the total taxable value of land and additions on the property. | Land | Improvement |
|---|---|---|---|---|
| 2025 | $458 | $4,995 | $360 | $4,635 |
| 2024 | $431 | $4,757 | $360 | $4,397 |
| 2023 | $398 | $4,680 | $360 | $4,320 |
| 2022 | $360 | $4,255 | $360 | $3,895 |
| 2021 | $376 | $4,255 | $360 | $3,895 |
| 2020 | $373 | $4,221 | $360 | $3,861 |
| 2019 | $355 | $4,020 | $360 | $3,660 |
| 2018 | $343 | $3,829 | $360 | $3,469 |
| 2017 | $323 | $3,646 | $360 | $3,286 |
| 2016 | $308 | $3,472 | $360 | $3,112 |
| 2015 | $285 | $3,308 | $360 | $2,948 |
| 2014 | $273 | $3,150 | $360 | $2,790 |
Source: Public Records
Map
Nearby Homes
- 611 N Clearcrest Ave
- 507 N Clearcrest Ave
- 613 N Clearcrest Ave
- 505 N Clearcrest Ave
- 508 N Prairie Ave
- 610 N Prairie Ave
- 506 N Prairie Ave
- 508 N Clearcrest Ave
- 612 N Prairie Ave
- 504 N Prairie Ave
- 506 N Clearcrest Ave
- 615 N Clearcrest Ave
- 610 N Clearcrest Ave
- 503 N Clearcrest Ave
- 504 N Clearcrest Ave
- 612 N Clearcrest Ave
- 614 N Prairie Ave
- 502 N Prairie Ave
- 617 N Clearcrest Ave
- 501 N Clearcrest Ave