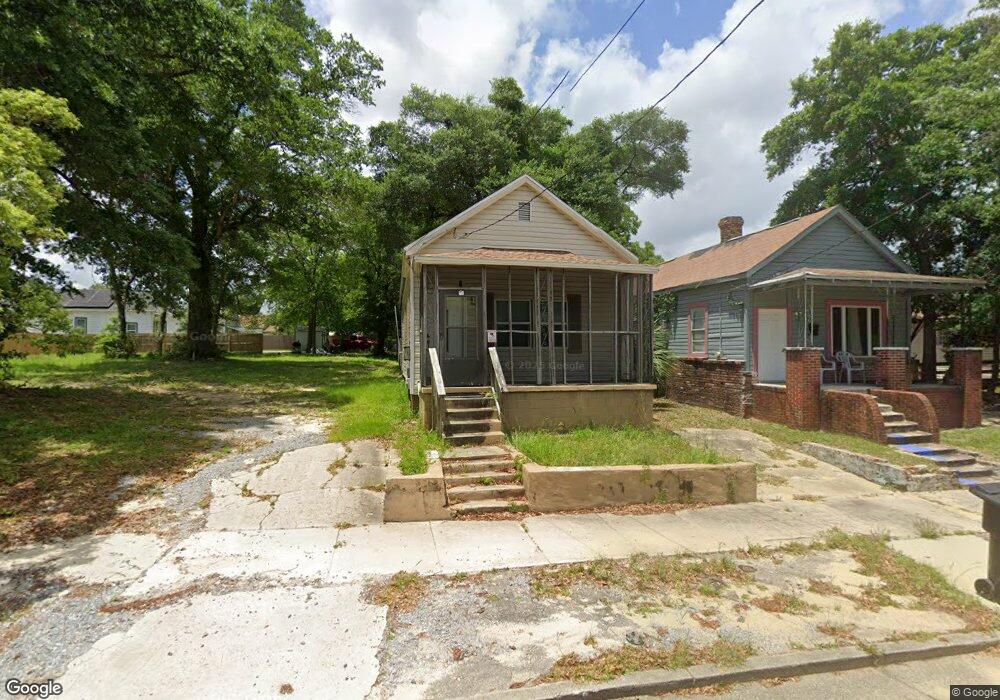
509 N G St Pensacola, FL 32501
Estimated Value: $105,386 - $228,000
--
Bed
1
Bath
972
Sq Ft
$183/Sq Ft
Est. Value
About This Home
This home is located at 509 N G St, Pensacola, FL 32501 and is currently estimated at $177,597, approximately $182 per square foot. 509 N G St is a home located in Escambia County with nearby schools including Warrington Middle School, Pensacola High School, and Escambia Christian School.
Ownership History
Date
Name
Owned For
Owner Type
Purchase Details
Closed on
Aug 23, 2019
Sold by
Peacock Ossie
Bought by
Sorey Arthur
Current Estimated Value
Purchase Details
Closed on
Jun 5, 2008
Sold by
Stallworth Alexander
Bought by
Peacock Carrie Stall Worth
Purchase Details
Closed on
Jan 10, 2000
Sold by
Monroe Kenneth P
Bought by
Stallworth Alexander
Purchase Details
Closed on
Jan 9, 2000
Sold by
Cork Kimberly Monroe
Bought by
Stallworth Alexander
Purchase Details
Closed on
Dec 28, 1999
Sold by
Monroe Karen A
Bought by
Stallworth Alexander
Create a Home Valuation Report for This Property
The Home Valuation Report is an in-depth analysis detailing your home's value as well as a comparison with similar homes in the area
Home Values in the Area
Average Home Value in this Area
Purchase History
| Date | Buyer | Sale Price | Title Company |
|---|---|---|---|
| Sorey Arthur | -- | Attorney | |
| Peacock Carrie Stall Worth | -- | None Available | |
| Stallworth Alexander | $400 | -- | |
| Stallworth Alexander | $400 | -- | |
| Stallworth Alexander | -- | -- |
Source: Public Records
Tax History Compared to Growth
Tax History
| Year | Tax Paid | Tax Assessment Tax Assessment Total Assessment is a certain percentage of the fair market value that is determined by local assessors to be the total taxable value of land and additions on the property. | Land | Improvement |
|---|---|---|---|---|
| 2024 | $302 | $45,338 | -- | -- |
| 2023 | $302 | $44,018 | $0 | $0 |
| 2022 | $347 | $42,736 | $0 | $0 |
| 2021 | $331 | $41,492 | $0 | $0 |
| 2020 | $315 | $40,920 | $0 | $0 |
| 2019 | $625 | $39,131 | $0 | $0 |
| 2018 | $579 | $35,063 | $0 | $0 |
| 2017 | $494 | $24,823 | $0 | $0 |
| 2016 | $489 | $24,220 | $0 | $0 |
| 2015 | $477 | $23,213 | $0 | $0 |
| 2014 | $459 | $22,156 | $0 | $0 |
Source: Public Records
Map
Nearby Homes