NOT LISTED FOR SALE

509 N High St Salem, IN 47167

Estimated Value: $150,000 - $242,000

4 Beds
3 Baths
1,292 Sq Ft
$152/Sq Ft Est. Value

Last Sold September 11, 2017

Last sale price $22,000 $17 Per Sq Ft

Est. 791% increase in value since last sale

Current estimated payment $1,377/month

368 Days on Market

About This Home

As of September 2017

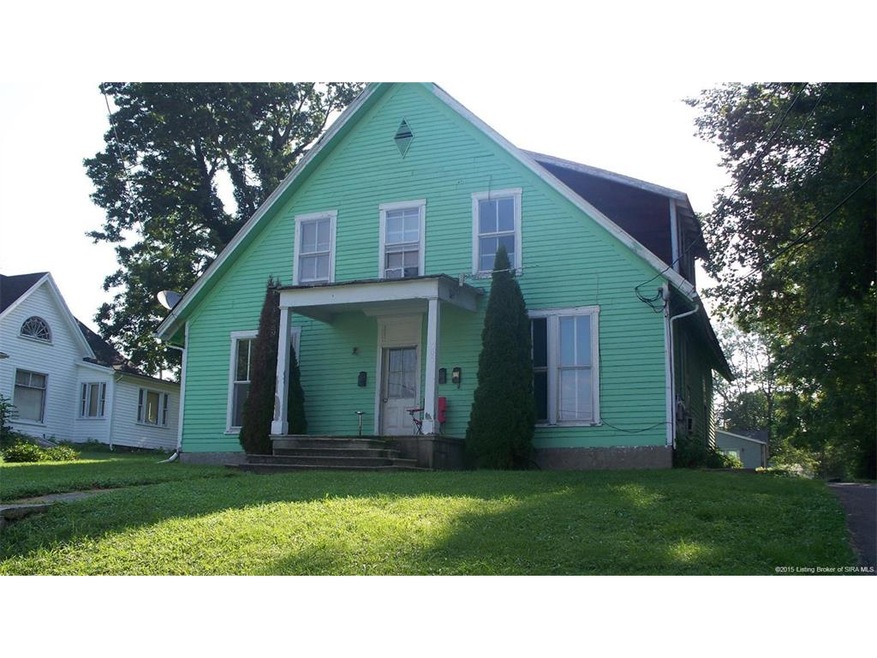
ATTENTION INVESTORS! This 3 unit income producing property features 1 two bedroom apartment, and 2 one bedroom apartment with shared laundry on-site.

Last Agent to Sell the Property

Kym Young

License #RB16000267 Listed on: 07/29/2016

Last Buyer's Agent

Kym Young

License #RB16000267 Listed on: 07/29/2016

Home Details

Home Type

  • Single Family

Year Built

  • Built in 1940

Lot Details

  • 0.3 Acre Lot
  • Property is zoned Multi Family

Parking

  • 4 Car Garage
  • On-Street Parking

Home Design

  • 1,292 Sq Ft Home
  • Block Foundation
  • Frame Construction

Kitchen

  • Oven or Range

Bedrooms and Bathrooms

  • 4 Bedrooms
  • 3 Full Bathrooms

Utilities

  • Window Unit Cooling System
  • Baseboard Heating
  • Electric Water Heater

Additional Features

  • Unfinished Basement

Listing and Financial Details

  • Assessor Parcel Number 882417224022000022

Home Details

Home Type

Single Family

Year Built

Built in 1940

Lot Details

0

Parking

4

Listing Details

  • Improvements: 43800
  • Additional Parking: On Street
  • Annual Tax: 1096
  • Appointment: Mandatory
  • Construction: Frame On-Site
  • Foundation: Concrete Block
  • Land Assessment: 15000
  • Legal Description: PT NW 17-2-4 .3 AC
  • Numof Fireplaces: 0
  • Parcel Number: 882417224022000022
  • Property Sub Type: Residential
  • Property Type: Residential/Farm
  • Total: 58800
  • Total Finished Square Footage: 1292
  • Year Built: 1940
  • Special Features: None

Interior Features

  • Water Heater: Electric
  • Basement Type: Unfinished
  • Above Grade Finished Sq Ft: 1292.00
  • Appliances: Range / Oven, Refrigerator
  • Full Bathrooms: 3
  • Total Bathrooms: 3.00
  • Total Bedrooms: 4
  • Lot Measurement: Acres
  • Lot Sq Ft: 13068.00
  • Room Count: 6
  • Sewer Type: Sewer
  • Total Sq Ft: 1292
  • Total Rooms: 6

Garage/Parking

  • Garage Spaces: 4

Utilities

  • Cooling Type: Window A/C Unit(s)
  • Heat Type: Baseboard
  • Water Type: Public Onsite

Schools

  • School District: Salem Comm.

Lot Info

  • Acres: 0.3000
  • Zoning: Multi Family

Ownership History

Date Name Owned For Owner Type

Purchase Details

Closed on
Jan 11, 2019
Sold by
Lee Travis
Bought by
George Joseph and George Laura
Current Estimated Value
$196,000

Home Financials for this Owner

Home Financials are based on the most recent Mortgage that was taken out on this home.
Original Mortgage
$111,300
Outstanding Balance
$74,165
Interest Rate
4.7%
Mortgage Type
Commercial
Estimated Equity
$165,335

Purchase Details

Listed on
Jul 29, 2016
Closed on
Sep 11, 2017
Sold by
Robert Amick Justus
Bought by
Laura George
Seller's Agent
Kym Young
Buyer's Agent
Kym Young
List Price
$59,900
Sold Price
$22,000
Premium/Discount to List
-$37,900
-63.27%

Home Financials for this Owner

Home Financials are based on the most recent Mortgage that was taken out on this home.
Avg. Annual Appreciation
35.13%

Purchase Details

Closed on
Dec 14, 2012
Sold by
Donnell Jack L
Bought by
Donnell Hlen A
Source: Public Records

Range of Values:

Collateral Analytics

Collateral Analytics Collateral Analytics AVMs (Automated Valuation Model) employ a number of statistical approaches combined with neighborhood-specific comparable selection guarantees the most up-to-date and precise valuations.

Not Available

Collateral Analytics does not have data for the current month. Please view the chart for historical values.

ICE

ICE Mortgage Technology ICE Mortgage Technology’s AVM (Automated Valuation Model) is a state-of-the-art online residential property valuation tool that provides a quick and accurate estimate of the value of almost any home in the U.S.

Not Available

ICE Mortgage Technology does not have data for the current month. Please view the chart for historical values.

First American

First American First American Data & Analytics’ next-generation AVM combines unrivaled data assets with a blended ensemble of valuation models to produce highly accurate, reliable valuations you can trust.

Not Available

First American does not have data for the current month. Please view the chart for historical values.

Quantarium

Quantarium Quantarium’s valuation service, repeatedly proven the industry’s most accurate and comprehensive, is supercharged with a self-learning and auto-tuning AI engine that continually becomes smarter and more accurate as it processes daily inputs from the industry’s leading RE data lake.

Not Available

Quantarium does not have data for the current month. Please view the chart for historical values.

Average Value
Not Available
List Price
Sold Price
Create a Home Valuation Report for This Property
The Home Valuation Report is an in-depth analysis detailing your home's value as well as a comparison with similar homes in the area

Home Values in the Area

Source: Public Records

Average Home Value in this Area


Source: Public Records

Purchase History

Date Buyer Sale Price Title Company
George Joseph -- None Available
Laura George $22,000 --
Donnell Hlen A -- None Available
Source: Public Records

Mortgage History

Date Status Borrower Loan Amount
Open George Joseph $111,300
Previous Owner Donnell Jack L $20,000
Source: Public Records

Property History

Date Event Price Change Sq Ft Price
09/11/2017 09/11/17 Sold $22,000 -63.3% $17 / Sq Ft
08/01/2017 08/01/17 Pending -- -- --
07/29/2016 07/29/16 For Sale $59,900 -- $46 / Sq Ft
Source: Southern Indiana REALTORS® Association

Tax History Compared to Growth

Source: Public Records

Tax History

Year Tax Paid Tax Assessment Tax Assessment Total Assessment is a certain percentage of the fair market value that is determined by local assessors to be the total taxable value of land and additions on the property. Land Improvement
2024 $3,704 $185,200 $15,000 $170,200
2023 $3,350 $167,500 $15,000 $152,500
2022 $2,946 $147,300 $15,000 $132,300
2021 $2,682 $134,100 $15,000 $119,100
2020 $2,592 $129,600 $15,000 $114,600
2019 $2,538 $126,900 $15,000 $111,900
2018 $842 $42,100 $15,000 $27,100
2017 $1,176 $58,800 $15,000 $43,800
2016 $1,096 $54,800 $15,000 $39,800
2014 $1,064 $53,200 $12,800 $40,400
2013 $1,080 $54,000 $15,000 $39,000
Source: Public Records

Agents Affiliated with this Home

  • Section Image
See All Agents

Map

Source: Southern Indiana REALTORS® Association

MLS Number: 201605191

Southern Indiana REALTORS® Association

APN: 88-24-17-224-022.000-022