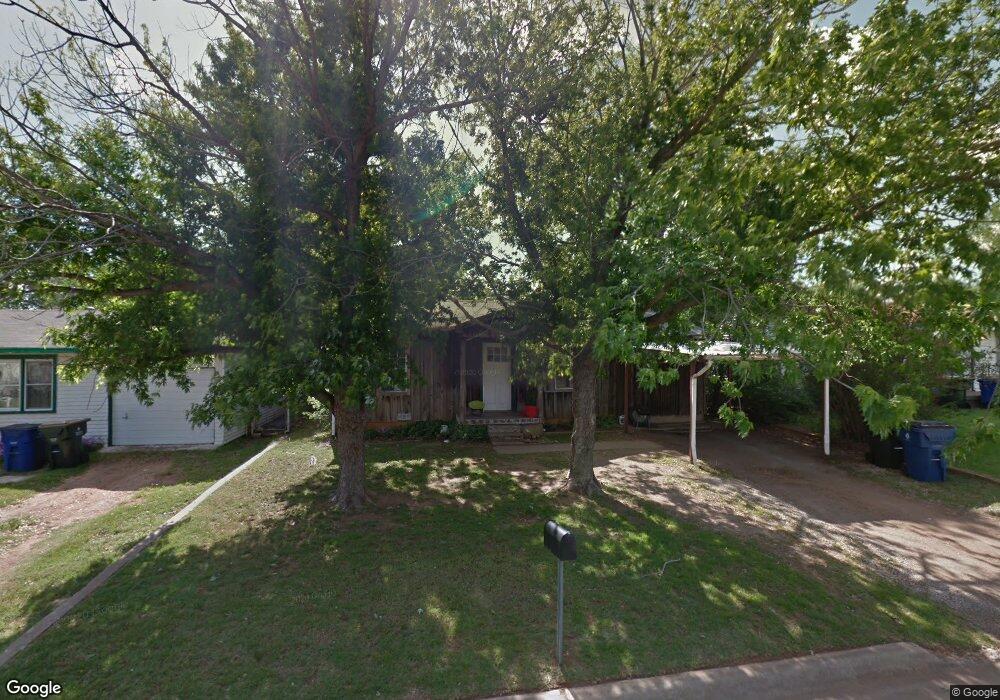
509 N J St Duncan, OK 73533
Estimated Value: $35,000 - $47,000
2
Beds
1
Bath
1,070
Sq Ft
$39/Sq Ft
Est. Value
About This Home
This home is located at 509 N J St, Duncan, OK 73533 and is currently estimated at $41,261, approximately $38 per square foot. 509 N J St is a home located in Stephens County with nearby schools including Woodrow Wilson Elementary School, Duncan Middle School, and Duncan High School.
Ownership History
Date
Name
Owned For
Owner Type
Purchase Details
Closed on
Jul 16, 2024
Sold by
Page Danny
Bought by
Mbr Construction Inc
Current Estimated Value
Home Financials for this Owner
Home Financials are based on the most recent Mortgage that was taken out on this home.
Original Mortgage
$25,880
Outstanding Balance
$25,540
Interest Rate
6.87%
Mortgage Type
New Conventional
Estimated Equity
$15,721
Purchase Details
Closed on
May 11, 2010
Sold by
The Swartz & Brough Inc
Bought by
Page Danny
Purchase Details
Closed on
Jun 15, 2009
Sold by
Winters James G and Doe Jane
Bought by
Swartz & Brough Inc
Purchase Details
Closed on
May 4, 2006
Sold by
Swartz & Brough Inc
Bought by
Winters James G
Home Financials for this Owner
Home Financials are based on the most recent Mortgage that was taken out on this home.
Original Mortgage
$23,400
Interest Rate
6.4%
Mortgage Type
FHA
Purchase Details
Closed on
Feb 14, 1997
Sold by
Atkins Mary K
Create a Home Valuation Report for This Property
The Home Valuation Report is an in-depth analysis detailing your home's value as well as a comparison with similar homes in the area
Home Values in the Area
Average Home Value in this Area
Purchase History
| Date | Buyer | Sale Price | Title Company |
|---|---|---|---|
| Mbr Construction Inc | $32,500 | Legacy Title | |
| Page Danny | $8,000 | None Available | |
| Swartz & Brough Inc | -- | None Available | |
| Winters James G | $26,000 | None Available | |
| -- | $10,000 | -- |
Source: Public Records
Mortgage History
| Date | Status | Borrower | Loan Amount |
|---|---|---|---|
| Open | Mbr Construction Inc | $25,880 | |
| Previous Owner | Winters James G | $23,400 |
Source: Public Records
Tax History Compared to Growth
Tax History
| Year | Tax Paid | Tax Assessment Tax Assessment Total Assessment is a certain percentage of the fair market value that is determined by local assessors to be the total taxable value of land and additions on the property. | Land | Improvement |
|---|---|---|---|---|
| 2025 | $324 | $3,844 | $294 | $3,550 |
| 2024 | $246 | $2,888 | $294 | $2,594 |
| 2023 | $246 | $2,888 | $294 | $2,594 |
| 2022 | $223 | $2,751 | $294 | $2,457 |
| 2021 | $223 | $2,620 | $294 | $2,326 |
| 2020 | $205 | $2,376 | $294 | $2,082 |
| 2019 | $200 | $2,315 | $294 | $2,021 |
| 2018 | $206 | $2,315 | $294 | $2,021 |
| 2017 | $197 | $2,293 | $294 | $1,999 |
| 2016 | $203 | $2,387 | $294 | $2,093 |
| 2015 | $218 | $2,387 | $294 | $2,093 |
| 2014 | $218 | $2,387 | $294 | $2,093 |
Source: Public Records
Map
Nearby Homes