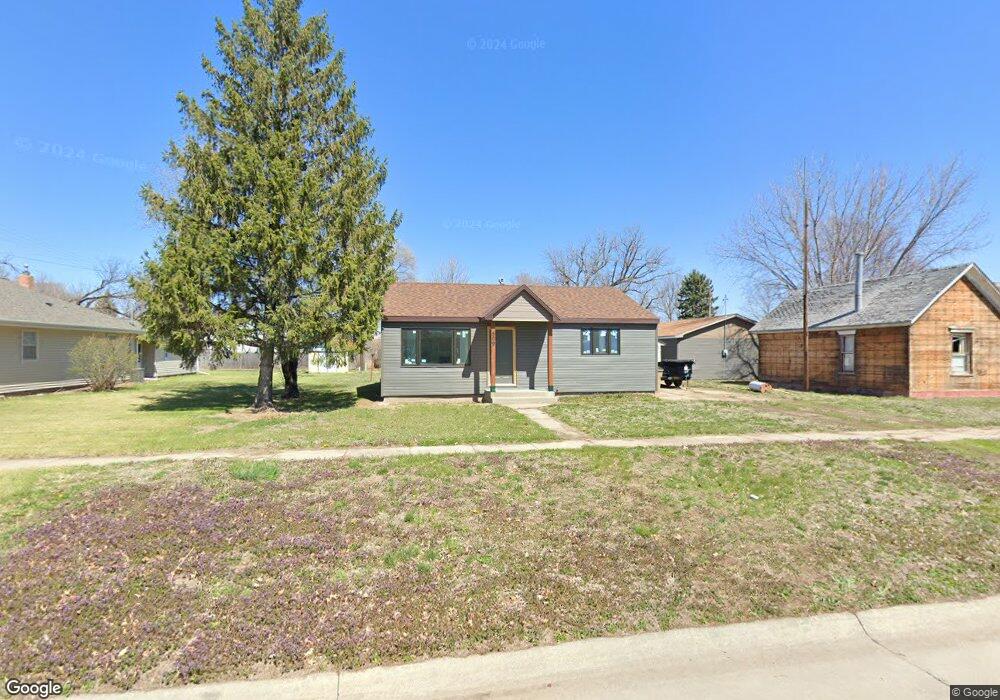
509 N St Aurora, NE 68818
Estimated Value: $138,931 - $218,000
3
Beds
1
Bath
936
Sq Ft
$186/Sq Ft
Est. Value
About This Home
This home is located at 509 N St, Aurora, NE 68818 and is currently estimated at $174,233, approximately $186 per square foot. 509 N St is a home located in Hamilton County with nearby schools including Aurora Elementary School, Aurora Middle School, and Aurora High School.
Ownership History
Date
Name
Owned For
Owner Type
Purchase Details
Closed on
Mar 2, 2021
Sold by
Cook Jean L and Cook Brian L
Bought by
Buoy Bryce D
Current Estimated Value
Home Financials for this Owner
Home Financials are based on the most recent Mortgage that was taken out on this home.
Original Mortgage
$60,250
Outstanding Balance
$53,640
Interest Rate
2.7%
Mortgage Type
Future Advance Clause Open End Mortgage
Estimated Equity
$120,593
Purchase Details
Closed on
Dec 11, 2020
Sold by
Rinke Debra A and Estate Of William Rinke
Bought by
Rinke Debra A and Cook Jean L
Create a Home Valuation Report for This Property
The Home Valuation Report is an in-depth analysis detailing your home's value as well as a comparison with similar homes in the area
Home Values in the Area
Average Home Value in this Area
Purchase History
| Date | Buyer | Sale Price | Title Company |
|---|---|---|---|
| Buoy Bryce D | $75,000 | Grand Island Abstract Escrow | |
| Rinke Debra A | -- | None Available |
Source: Public Records
Mortgage History
| Date | Status | Borrower | Loan Amount |
|---|---|---|---|
| Open | Buoy Bryce D | $60,250 |
Source: Public Records
Tax History
| Year | Tax Paid | Tax Assessment Tax Assessment Total Assessment is a certain percentage of the fair market value that is determined by local assessors to be the total taxable value of land and additions on the property. | Land | Improvement |
|---|---|---|---|---|
| 2025 | $918 | $120,155 | $15,750 | $104,405 |
| 2024 | $918 | $78,670 | $15,750 | $62,920 |
| 2023 | $606 | $42,965 | $15,750 | $27,215 |
| 2022 | $643 | $42,965 | $15,750 | $27,215 |
| 2021 | $1,141 | $75,035 | $15,750 | $59,285 |
| 2020 | $1,112 | $75,035 | $15,750 | $59,285 |
| 2019 | $1,040 | $70,645 | $15,750 | $54,895 |
| 2018 | $994 | $70,645 | $15,750 | $54,895 |
| 2017 | $940 | $66,710 | $11,815 | $54,895 |
| 2016 | $869 | $63,525 | $9,450 | $54,075 |
| 2010 | $1,204 | $63,525 | $0 | $0 |
Source: Public Records
Map
Nearby Homes
Your Personal Tour Guide
Ask me questions while you tour the home.