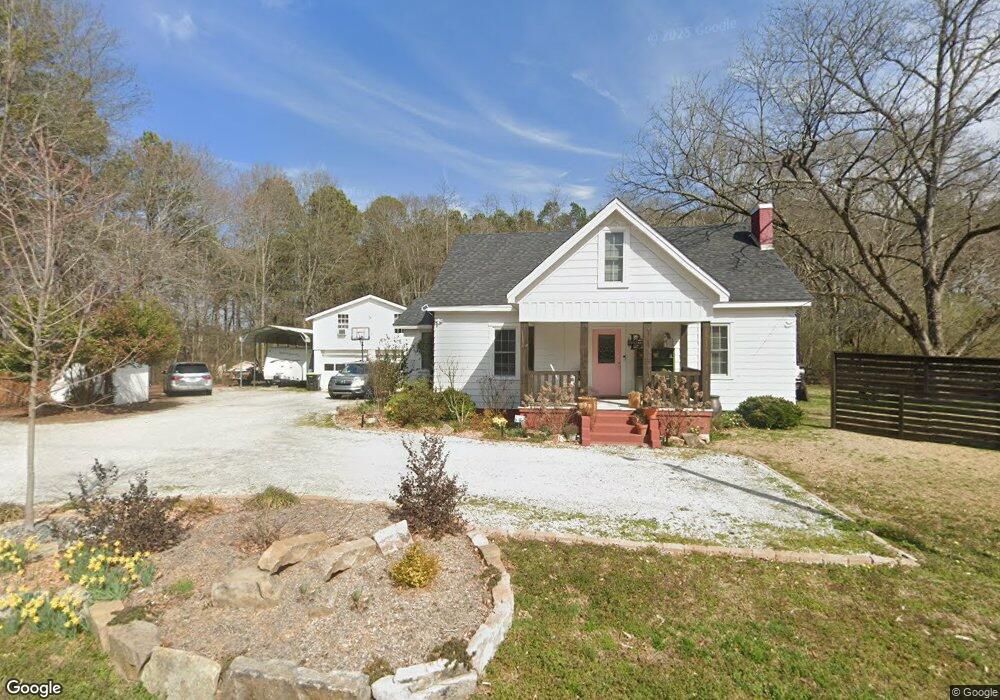
509 N van Wert Rd Villa Rica, GA 30180
Estimated Value: $242,000 - $284,237
4
Beds
2
Baths
2,536
Sq Ft
$103/Sq Ft
Est. Value
About This Home
This home is located at 509 N van Wert Rd, Villa Rica, GA 30180 and is currently estimated at $260,309, approximately $102 per square foot. 509 N van Wert Rd is a home located in Carroll County with nearby schools including Villa Rica Elementary School, Villa Rica Middle School, and Villa Rica High School.
Ownership History
Date
Name
Owned For
Owner Type
Purchase Details
Closed on
May 18, 2020
Sold by
Williams Jolene E
Bought by
Bennett Matt and Bennett Abigail Joy
Current Estimated Value
Home Financials for this Owner
Home Financials are based on the most recent Mortgage that was taken out on this home.
Original Mortgage
$116,400
Outstanding Balance
$103,147
Interest Rate
3.3%
Mortgage Type
New Conventional
Estimated Equity
$157,162
Purchase Details
Closed on
Jun 7, 2012
Sold by
Bank Of America
Bought by
Williams Jolene E
Purchase Details
Closed on
Mar 1, 2012
Purchase Details
Closed on
Dec 31, 2003
Sold by
Mcpherson Marilyn B
Bought by
Otwell Jon
Purchase Details
Closed on
Jan 7, 2003
Sold by
Otwell Jon
Bought by
Otwell Jon
Purchase Details
Closed on
Dec 18, 1997
Sold by
Mcpherson John C
Bought by
Mcpherson Marilyn B
Purchase Details
Closed on
Feb 29, 1988
Bought by
Mcpherson John C
Create a Home Valuation Report for This Property
The Home Valuation Report is an in-depth analysis detailing your home's value as well as a comparison with similar homes in the area
Home Values in the Area
Average Home Value in this Area
Purchase History
| Date | Buyer | Sale Price | Title Company |
|---|---|---|---|
| Bennett Matt | $120,000 | -- | |
| Williams Jolene E | $20,500 | -- | |
| -- | $25,900 | -- | |
| Otwell Jon | $80,000 | -- | |
| Otwell Jon | -- | -- | |
| Mcpherson Marilyn B | -- | -- | |
| Mcpherson John C | -- | -- |
Source: Public Records
Mortgage History
| Date | Status | Borrower | Loan Amount |
|---|---|---|---|
| Open | Bennett Matt | $116,400 |
Source: Public Records
Tax History Compared to Growth
Tax History
| Year | Tax Paid | Tax Assessment Tax Assessment Total Assessment is a certain percentage of the fair market value that is determined by local assessors to be the total taxable value of land and additions on the property. | Land | Improvement |
|---|---|---|---|---|
| 2024 | $1,571 | $82,119 | $7,204 | $74,915 |
| 2023 | $1,594 | $74,587 | $5,763 | $68,824 |
| 2022 | $1,323 | $59,081 | $3,842 | $55,239 |
| 2021 | $1,128 | $51,338 | $3,074 | $48,264 |
| 2020 | $1,170 | $45,598 | $2,794 | $42,804 |
| 2019 | $1,106 | $42,741 | $2,794 | $39,947 |
| 2018 | $1,017 | $38,713 | $2,612 | $36,101 |
| 2017 | $1,020 | $38,713 | $2,612 | $36,101 |
| 2016 | $1,020 | $38,713 | $2,612 | $36,101 |
| 2015 | $780 | $27,896 | $3,593 | $24,304 |
| 2014 | $783 | $27,897 | $3,593 | $24,304 |
Source: Public Records
Map
Nearby Homes
- 413 Remington Ct
- 2737 Lake Paradise Rd
- 359 River Trace Dr
- 605 Sheffield Ct
- 3150 Old van Wert Rd
- 604 Meadows Ct
- 158 N Villa Rd
- 1021 Cown Rd
- 331 Hynes Dr
- 329 Hynes Dr
- 327 Hynes Dr
- 325 Hynes Dr
- 10 S Villa Rd
- 323 Hynes Dr
- 405 Lake Dr
- 315 Hynes Dr
- 122 Pine Needle Trail
- 15 Park Place
- 121 Luther Cir
- 102 Pine Bark Dr
- 575 N van Wert Rd
- 505 N van Wert Rd
- 604 N van Wert Rd
- 504 N van Wert Rd
- 309 River Trace Dr
- 101 Concorde Dr
- 305 River Trace Dr
- 313 River Trace Dr
- 703 N van Wert Rd
- 301 River Trace Dr
- 317 River Trace Dr
- 705 N van Wert Rd
- 321 River Trace Dr
- 425 N van Wert Rd
- 401 N van Wert Rd
- 325 River Trace Dr
- 310 River Trace Dr
- 329 329 River Trace
- 329 River Unit 210
- 329 River