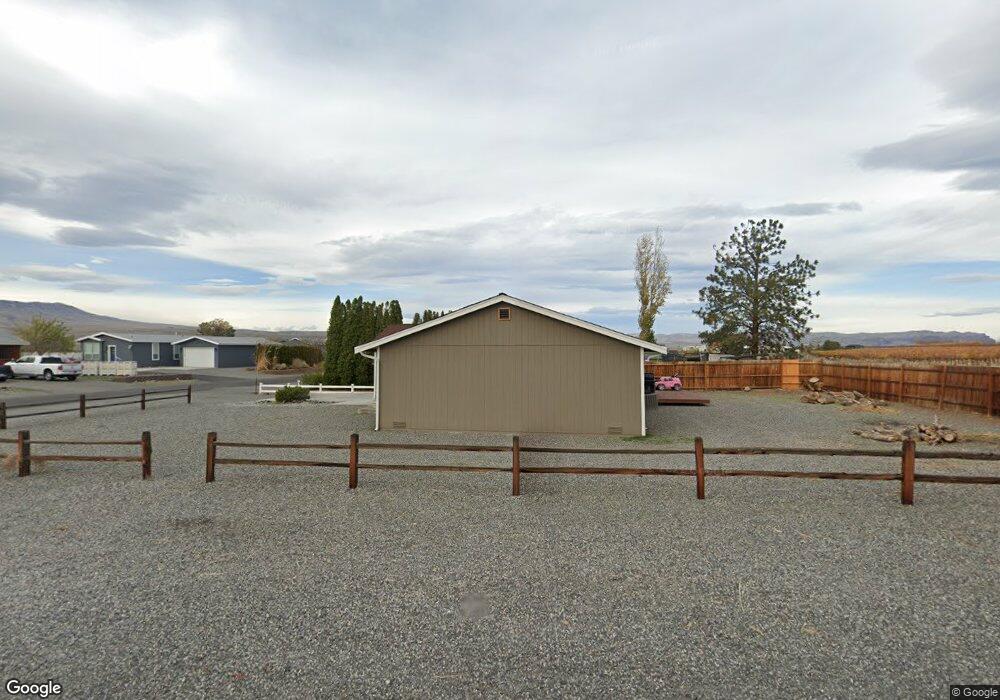
509 Oasis Place SW Mattawa, WA 99349
Estimated Value: $375,000 - $405,000
3
Beds
2
Baths
1,266
Sq Ft
$306/Sq Ft
Est. Value
About This Home
This home is located at 509 Oasis Place SW, Mattawa, WA 99349 and is currently estimated at $386,828, approximately $305 per square foot. 509 Oasis Place SW is a home located in Grant County with nearby schools including Wahluke High School.
Ownership History
Date
Name
Owned For
Owner Type
Purchase Details
Closed on
Jan 9, 2021
Sold by
Macclellan Mary and Burge Jennifer M
Bought by
Ledezma Jessica
Current Estimated Value
Home Financials for this Owner
Home Financials are based on the most recent Mortgage that was taken out on this home.
Original Mortgage
$247,000
Outstanding Balance
$219,943
Interest Rate
2.71%
Mortgage Type
New Conventional
Estimated Equity
$166,885
Purchase Details
Closed on
Jul 10, 2018
Sold by
Wetmore John and Wetmore Charlene
Bought by
Macclellan Mary and Burge Jennifer M
Home Financials for this Owner
Home Financials are based on the most recent Mortgage that was taken out on this home.
Original Mortgage
$185,250
Interest Rate
4.5%
Mortgage Type
New Conventional
Purchase Details
Closed on
Jul 3, 2006
Sold by
Leverich Archie
Bought by
Wetmore John and Wetmore Charlena
Create a Home Valuation Report for This Property
The Home Valuation Report is an in-depth analysis detailing your home's value as well as a comparison with similar homes in the area
Home Values in the Area
Average Home Value in this Area
Purchase History
| Date | Buyer | Sale Price | Title Company |
|---|---|---|---|
| Ledezma Jessica | $260,000 | Stewart Title | |
| Macclellan Mary | $195,000 | Chicago Title Ins | |
| Wetmore John | $20,000 | Security Title Guara |
Source: Public Records
Mortgage History
| Date | Status | Borrower | Loan Amount |
|---|---|---|---|
| Open | Ledezma Jessica | $247,000 | |
| Previous Owner | Macclellan Mary | $185,250 |
Source: Public Records
Tax History Compared to Growth
Tax History
| Year | Tax Paid | Tax Assessment Tax Assessment Total Assessment is a certain percentage of the fair market value that is determined by local assessors to be the total taxable value of land and additions on the property. | Land | Improvement |
|---|---|---|---|---|
| 2025 | $3,323 | $339,731 | -- | -- |
| 2024 | $2,941 | $306,244 | $83,000 | $223,244 |
| 2023 | $2,513 | $211,915 | $35,500 | $176,415 |
| 2022 | $2,281 | $211,915 | $35,500 | $176,415 |
| 2021 | $2,269 | $211,915 | $35,500 | $176,415 |
| 2020 | $2,002 | $204,065 | $35,500 | $168,565 |
| 2019 | $2,078 | $177,960 | $25,000 | $152,960 |
| 2018 | $2,418 | $188,595 | $25,000 | $163,595 |
| 2017 | $1,833 | $152,240 | $25,000 | $127,240 |
| 2016 | $1,759 | $146,510 | $20,000 | $126,510 |
| 2013 | -- | $152,830 | $25,000 | $127,830 |
Source: Public Records
Map
Nearby Homes
- 308 Spring Cir
- 334 Spring Cir W Unit 69
- 613 Tradewind Way S
- 334 Rainbow Place W
- 310 Buttercup Ln SW
- 344 Rainbow Place W
- 19946 E Desert Aire Dr SW
- 207 Green Laurel Place
- 114 Yucca Place
- 227 Sunshine Cir S
- 106 Yucca Place S
- 513 Tyler Place SW
- 412 Apple Place SW
- 206 Cherry Ln W
- 204 Cherry Ln W
- 453 Airport Way SW
- 205 Fairway Place S
- 514 Island View S
- 313 Airport Way SW
- 447 Airport Way SW
- 509 Oasis Place S
- 515 517 Oasis Place S
- 505 Oasis Place S
- 512 Oasis Place SW
- 510 Oasis Place S
- 515 Oasis Place SW
- 503 Oasis Place SW
- 518 Oasis Place S
- 520 Oasis Place SW
- 501 Oasis Place SW
- 501 Fowler Ln SW
- 504 Oasis Place S
- 504 Oasis Place SW
- 503 Fowler Ln S
- 503 Fowler Ln S Unit 40
- 501 Fowler Ln S
- 522 Oasis Place S
- 505 Fowler Ln S
- 203 Olive Place S
- 203 Olive Place SW