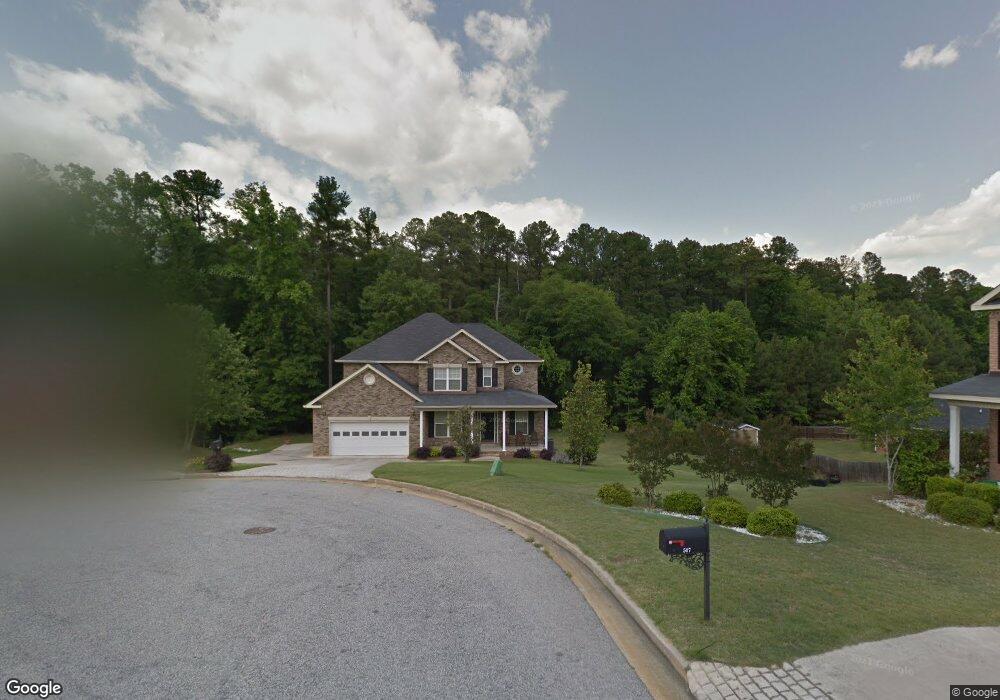
509 Pavilion Ct Augusta, GA 30907
Estimated Value: $402,000 - $471,000
4
Beds
3
Baths
2,630
Sq Ft
$164/Sq Ft
Est. Value
About This Home
This home is located at 509 Pavilion Ct, Augusta, GA 30907 and is currently estimated at $432,458, approximately $164 per square foot. 509 Pavilion Ct is a home located in Columbia County with nearby schools including Stevens Creek Elementary School, Stallings Island Middle School, and Lakeside High School.
Ownership History
Date
Name
Owned For
Owner Type
Purchase Details
Closed on
May 15, 2008
Sold by
Bartig Matthew J
Bought by
Pickens Charles T
Current Estimated Value
Home Financials for this Owner
Home Financials are based on the most recent Mortgage that was taken out on this home.
Original Mortgage
$216,000
Outstanding Balance
$136,649
Interest Rate
5.86%
Mortgage Type
New Conventional
Estimated Equity
$295,809
Purchase Details
Closed on
Mar 12, 2007
Sold by
Mateka John
Bought by
Bartig Matthew J
Home Financials for this Owner
Home Financials are based on the most recent Mortgage that was taken out on this home.
Original Mortgage
$206,400
Interest Rate
6.22%
Mortgage Type
New Conventional
Purchase Details
Closed on
Sep 27, 2005
Sold by
Pierwood Construction Co
Bought by
Mateka John and Mateka Bonita
Home Financials for this Owner
Home Financials are based on the most recent Mortgage that was taken out on this home.
Original Mortgage
$200,000
Interest Rate
5.66%
Mortgage Type
New Conventional
Create a Home Valuation Report for This Property
The Home Valuation Report is an in-depth analysis detailing your home's value as well as a comparison with similar homes in the area
Home Values in the Area
Average Home Value in this Area
Purchase History
| Date | Buyer | Sale Price | Title Company |
|---|---|---|---|
| Pickens Charles T | $270,000 | -- | |
| Bartig Matthew J | $258,000 | -- | |
| Mateka John | $250,000 | -- |
Source: Public Records
Mortgage History
| Date | Status | Borrower | Loan Amount |
|---|---|---|---|
| Open | Pickens Charles T | $216,000 | |
| Previous Owner | Bartig Matthew J | $206,400 | |
| Previous Owner | Mateka John | $200,000 |
Source: Public Records
Tax History
| Year | Tax Paid | Tax Assessment Tax Assessment Total Assessment is a certain percentage of the fair market value that is determined by local assessors to be the total taxable value of land and additions on the property. | Land | Improvement |
|---|---|---|---|---|
| 2025 | $3,937 | $162,651 | $25,961 | $136,690 |
| 2024 | $3,979 | $156,945 | $25,961 | $130,984 |
| 2023 | $3,979 | $119,587 | $19,142 | $100,445 |
| 2022 | $3,345 | $126,487 | $19,142 | $107,345 |
| 2021 | $3,147 | $113,607 | $19,050 | $94,557 |
| 2020 | $3,022 | $106,762 | $17,852 | $88,910 |
| 2019 | $2,932 | $103,490 | $19,304 | $84,186 |
| 2018 | $3,021 | $106,358 | $18,404 | $87,954 |
| 2017 | $2,966 | $104,029 | $19,504 | $84,525 |
| 2016 | $2,753 | $99,964 | $18,780 | $81,184 |
| 2015 | $2,664 | $96,498 | $17,080 | $79,418 |
| 2014 | $2,715 | $97,148 | $18,280 | $78,868 |
Source: Public Records
Map
Nearby Homes
- 835 Audubon Way
- 3666 Bay Point
- 615 Saw Grass Dr
- 4020 Firethorn Ct
- 3901 Blackstone Camp Rd
- 3684 Inverness Way
- 608 Saw Grass Dr
- 619 Baytree Ct
- 856 Point Comfort Rd
- 3673 Cypress Point Dr
- 5207 Teal Ln
- 3830 Honors Way
- 445 Jade Dr
- 615 Baytree Ct
- 215 Hornsby Ln
- 511 Seminole Place
- 5751 Carriage Hills Dr
- 587 Medinah Dr
- 4408 Ibis Way
- 2 Winged Foot Dr
- 510 Pavilion Ct
- 3702 Watery Crossing
- 507 Pavilion Ct
- 1260 Arcilla Point
- 1262 Arcilla Point
- 1262 Arcilla Pointe
- 1258 Arcilla Point
- 1258 Arcilla Pointe
- 1260 Arcilla Pointe
- 508 Pavilion Ct
- 1264 Arcilla Point
- 1256 Arcilla Point
- 764 Locks Way
- 1256 Arcilla Pointe
- 1254 Arcilla Point
- 3713 Pavilion Dr
- 1254 Arcilla Pointe
- 505 Pavilion Ct
- 3711 Pavilion Dr
- 1266 Arcilla Point
Your Personal Tour Guide
Ask me questions while you tour the home.