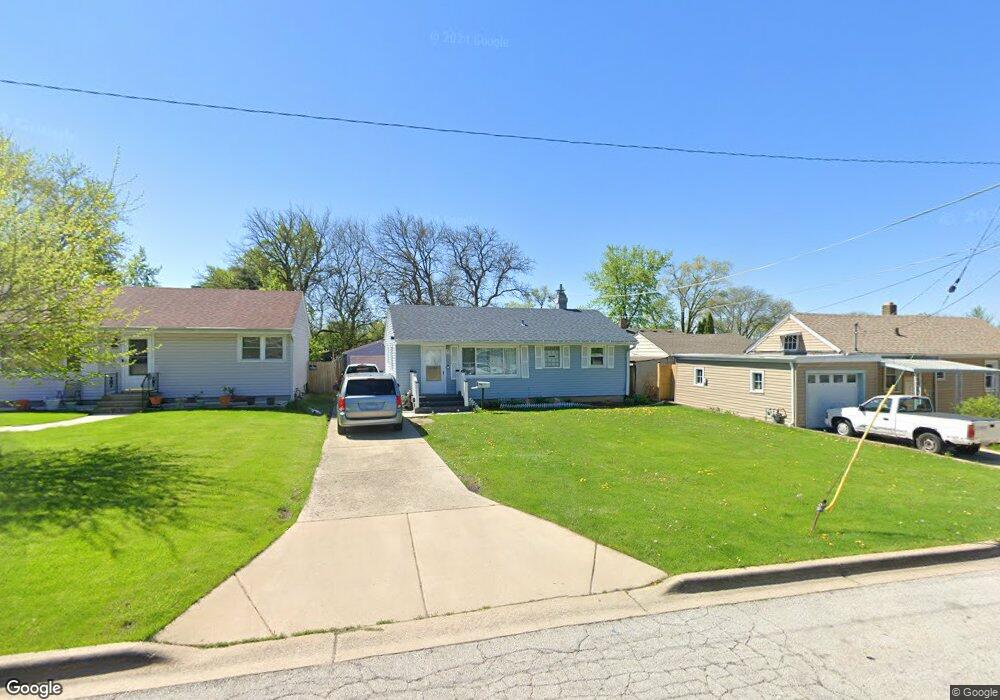
509 Pine Ave Aurora, IL 60505
Pigeon Hill NeighborhoodEstimated Value: $224,373 - $301,000
3
Beds
1
Bath
1,075
Sq Ft
$242/Sq Ft
Est. Value
About This Home
This home is located at 509 Pine Ave, Aurora, IL 60505 and is currently estimated at $260,343, approximately $242 per square foot. 509 Pine Ave is a home located in Kane County with nearby schools including Nicholas A Hermes Elementary School, Simmons Middle School, and East Aurora High School.
Ownership History
Date
Name
Owned For
Owner Type
Purchase Details
Closed on
Jun 16, 2011
Sold by
Lakeside Enterprises Of Illinois Llc
Bought by
Amezquita Fernando
Current Estimated Value
Home Financials for this Owner
Home Financials are based on the most recent Mortgage that was taken out on this home.
Original Mortgage
$95,515
Outstanding Balance
$65,970
Interest Rate
4.67%
Mortgage Type
FHA
Estimated Equity
$194,373
Purchase Details
Closed on
May 21, 2010
Sold by
Hsbc Bank Usa National Association
Bought by
Lakeside Enterprises Of Illinois Llc
Purchase Details
Closed on
Aug 31, 2000
Sold by
Gibson David L and Gibson Tammy S
Bought by
Avila Guadalupe and Avila Yesenia
Home Financials for this Owner
Home Financials are based on the most recent Mortgage that was taken out on this home.
Original Mortgage
$113,957
Interest Rate
8.14%
Mortgage Type
FHA
Create a Home Valuation Report for This Property
The Home Valuation Report is an in-depth analysis detailing your home's value as well as a comparison with similar homes in the area
Home Values in the Area
Average Home Value in this Area
Purchase History
| Date | Buyer | Sale Price | Title Company |
|---|---|---|---|
| Amezquita Fernando | $98,000 | First American Title | |
| Lakeside Enterprises Of Illinois Llc | $45,000 | None Available | |
| Avila Guadalupe | $115,000 | First American Title Ins Co |
Source: Public Records
Mortgage History
| Date | Status | Borrower | Loan Amount |
|---|---|---|---|
| Open | Amezquita Fernando | $95,515 | |
| Previous Owner | Avila Guadalupe | $113,957 |
Source: Public Records
Tax History
| Year | Tax Paid | Tax Assessment Tax Assessment Total Assessment is a certain percentage of the fair market value that is determined by local assessors to be the total taxable value of land and additions on the property. | Land | Improvement |
|---|---|---|---|---|
| 2024 | $3,024 | $52,117 | $9,048 | $43,069 |
| 2023 | $2,882 | $46,566 | $8,084 | $38,482 |
| 2022 | $2,624 | $40,539 | $7,376 | $33,163 |
| 2021 | $2,563 | $37,742 | $6,867 | $30,875 |
| 2020 | $2,416 | $35,056 | $6,378 | $28,678 |
| 2019 | $2,333 | $32,480 | $5,909 | $26,571 |
| 2018 | $2,866 | $37,475 | $5,466 | $32,009 |
| 2017 | $2,717 | $33,709 | $5,036 | $28,673 |
| 2016 | $2,971 | $34,235 | $4,317 | $29,918 |
| 2015 | -- | $29,899 | $3,712 | $26,187 |
| 2014 | -- | $27,729 | $3,411 | $24,318 |
| 2013 | -- | $27,592 | $3,621 | $23,971 |
Source: Public Records
Map
Nearby Homes
- 1009 Assell Ave
- 304 Hankes Ave
- 920 Zenner Ave
- 773 Aurora Ave
- 1220 Mitchell Rd
- 953 Sheffer Rd
- 611 Pierce St
- 14-18 N Lake St
- 907 Harley Ct
- 608 Front St
- 747 Delius St
- 1060 N Farnsworth Ave Unit 1105
- 338 Lakelawn Blvd
- 479 N Lake St
- 461 Wood St
- 469 N Lake St
- 605 Grove St
- 0000 N Farnsworth Ave
- 1578 Colleen Ln
- 231-233 Williams St
Your Personal Tour Guide
Ask me questions while you tour the home.