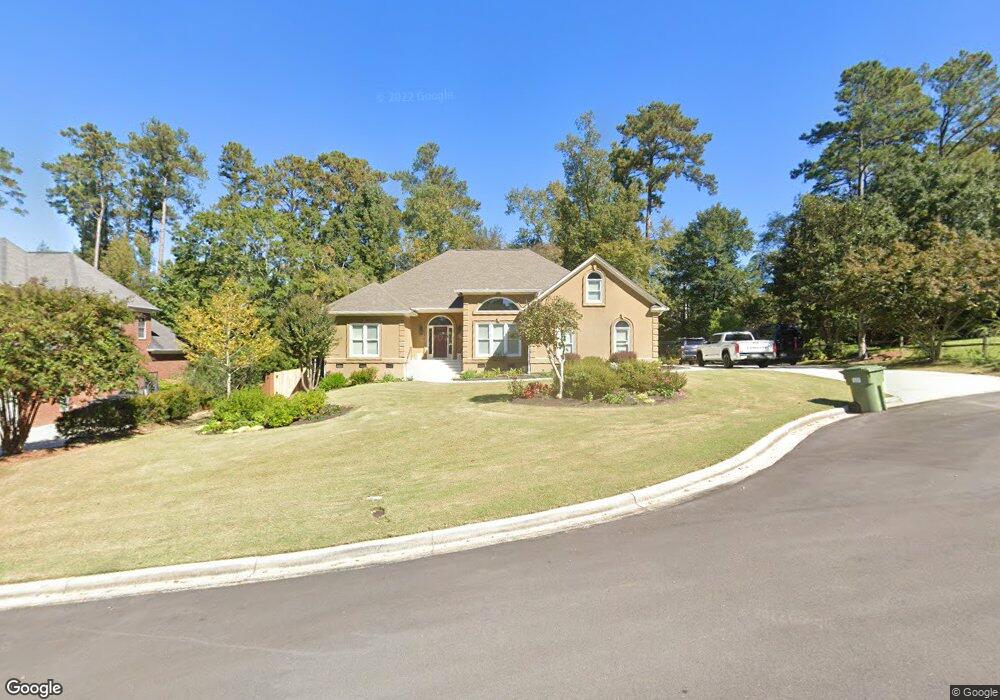
509 Pineview Ct Augusta, GA 30907
Estimated Value: $576,000 - $666,000
Studio
--
Bath
3,165
Sq Ft
$195/Sq Ft
Est. Value
About This Home
This home is located at 509 Pineview Ct, Augusta, GA 30907 and is currently estimated at $616,765, approximately $194 per square foot. 509 Pineview Ct is a home located in Columbia County with nearby schools including Stevens Creek Elementary School, Stallings Island Middle School, and Lakeside High School.
Ownership History
Date
Name
Owned For
Owner Type
Purchase Details
Closed on
Dec 16, 2025
Sold by
Way Anne Robinson
Bought by
Anne R Way Living Trust Dated July 28 20 and Way Anne R Trust
Current Estimated Value
Create a Home Valuation Report for This Property
The Home Valuation Report is an in-depth analysis detailing your home's value as well as a comparison with similar homes in the area
Home Values in the Area
Average Home Value in this Area
Purchase History
| Date | Buyer | Sale Price | Title Company |
|---|---|---|---|
| Anne R Way Living Trust Dated July 28 20 | -- | -- |
Source: Public Records
Tax History
| Year | Tax Paid | Tax Assessment Tax Assessment Total Assessment is a certain percentage of the fair market value that is determined by local assessors to be the total taxable value of land and additions on the property. | Land | Improvement |
|---|---|---|---|---|
| 2025 | $2,673 | $231,455 | $92,704 | $138,751 |
| 2024 | $2,609 | $219,095 | $51,104 | $167,991 |
| 2023 | $2,609 | $204,497 | $51,004 | $153,493 |
| 2022 | $2,464 | $194,332 | $44,404 | $149,928 |
| 2021 | $1,971 | $171,240 | $41,604 | $129,636 |
| 2020 | $2,242 | $169,004 | $38,604 | $130,400 |
| 2019 | $1,798 | $148,282 | $33,204 | $115,078 |
| 2018 | $2,173 | $156,991 | $38,204 | $118,787 |
| 2017 | $2,032 | $147,880 | $35,304 | $112,576 |
| 2016 | $1,953 | $144,056 | $34,580 | $109,476 |
| 2015 | $4,215 | $155,935 | $39,580 | $116,355 |
| 2014 | $4,144 | $151,449 | $41,280 | $110,169 |
Source: Public Records
Map
Nearby Homes
- 1119 Hampstead Place
- 1123 Hampstead Place
- 309 Old Salem Way
- 316 Wakefield Ln N
- 453 Timber Wolf Trail
- 315 Rabun Valley Ln
- 417 Preserve Trail
- 345 Old Salem Way
- 433 Cambridge Cir
- 716 Cool Brook Dr
- 705 Cool Brook Ct
- 2032 Pheasant Creek Dr
- 451 Highlands Ct
- 412 Hastings Place
- 248 Watervale Rd
- 719 Gentlewind Ln
- 3527 Gleneagles Dr
- 816 Brookfield Pkwy
- 3502 Prestwick Dr
- 2014 Autumn Chase
- 511 Pineview Ct
- 507 Pineview Ct
- 510 Ihnen Ct
- 508 Ihnen Ct
- 512 Ihnen Ct
- 512 Pineview Ct
- 510 Pineview Ct
- 513 Pineview Ct
- 508 Pineview Ct
- 514 Pineview Ct
- 3536 Granite Way
- 3562 Granite Way
- 3560 Granite Way
- 507 Ihnen Ct
- 3564 Granite Way
- 3544 Granite Way
- 511 Ihnen Ct
- 3558 Granite Way
- 3566 Granite Way
- 3546 Granite Way
Your Personal Tour Guide
Ask me questions while you tour the home.