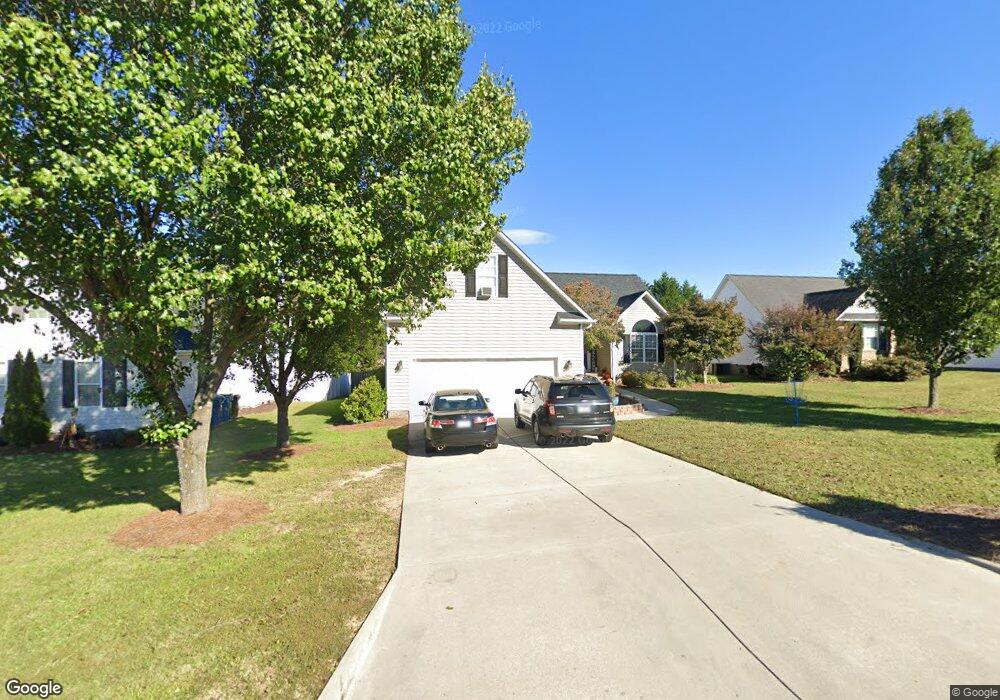
509 Powell Way Archdale, NC 27263
Estimated Value: $337,736 - $378,000
--
Bed
2
Baths
2,043
Sq Ft
$175/Sq Ft
Est. Value
About This Home
This home is located at 509 Powell Way, Archdale, NC 27263 and is currently estimated at $357,434, approximately $174 per square foot. 509 Powell Way is a home located in Randolph County with nearby schools including John R. Lawrence Elementary School, Wheatmore Middle School, and Trinity High School.
Ownership History
Date
Name
Owned For
Owner Type
Purchase Details
Closed on
May 15, 2006
Sold by
Bridges Eric and Bridges Crystal
Bought by
Shell James D and Shell Tera M
Current Estimated Value
Home Financials for this Owner
Home Financials are based on the most recent Mortgage that was taken out on this home.
Original Mortgage
$179,877
Outstanding Balance
$104,237
Interest Rate
6.41%
Mortgage Type
FHA
Estimated Equity
$253,197
Purchase Details
Closed on
Feb 25, 2005
Sold by
Leggett & Platt Inc
Bought by
Bridges Eric and Bridges Crystal
Home Financials for this Owner
Home Financials are based on the most recent Mortgage that was taken out on this home.
Original Mortgage
$166,630
Interest Rate
9.17%
Mortgage Type
Purchase Money Mortgage
Purchase Details
Closed on
Oct 24, 2002
Bought by
Shell James Derek Shell Tera M
Purchase Details
Closed on
Aug 8, 2002
Bought by
Shell James Derek Shell Tera M
Create a Home Valuation Report for This Property
The Home Valuation Report is an in-depth analysis detailing your home's value as well as a comparison with similar homes in the area
Home Values in the Area
Average Home Value in this Area
Purchase History
| Date | Buyer | Sale Price | Title Company |
|---|---|---|---|
| Shell James D | $183,000 | None Available | |
| Bridges Eric | $175,500 | -- | |
| Leggett & Platt Inc | $178,000 | -- | |
| Shell James Derek Shell Tera M | $164,000 | -- | |
| Shell James Derek Shell Tera M | $31,000 | -- |
Source: Public Records
Mortgage History
| Date | Status | Borrower | Loan Amount |
|---|---|---|---|
| Open | Shell James D | $179,877 | |
| Previous Owner | Bridges Eric | $166,630 |
Source: Public Records
Tax History Compared to Growth
Tax History
| Year | Tax Paid | Tax Assessment Tax Assessment Total Assessment is a certain percentage of the fair market value that is determined by local assessors to be the total taxable value of land and additions on the property. | Land | Improvement |
|---|---|---|---|---|
| 2024 | $2,681 | $260,220 | $52,500 | $207,720 |
| 2023 | $2,686 | $260,220 | $52,500 | $207,720 |
| 2022 | $2,059 | $173,370 | $25,200 | $148,170 |
| 2021 | $2,059 | $173,370 | $25,200 | $148,170 |
| 2020 | $2,012 | $173,370 | $25,200 | $148,170 |
| 2019 | $2,012 | $173,370 | $25,200 | $148,170 |
| 2018 | $1,692 | $142,140 | $25,200 | $116,940 |
| 2016 | $1,658 | $142,139 | $25,200 | $116,939 |
| 2015 | $1,663 | $142,139 | $25,200 | $116,939 |
| 2014 | $1,663 | $142,139 | $25,200 | $116,939 |
Source: Public Records
Map
Nearby Homes
- 305 Trey Ln
- 110 Deerfield Place
- 0-C Us Highway 311
- 9622 Us Highway 311
- 3827 Wood Ave
- 5110 Country Ln
- 5816 Trotter Country Rd
- 0-A Us Highway 311
- 0 Sprucewood Ct
- 0-B Us Highway 311
- 108 Sprucewood Ct
- 1021 Sagewood Ln
- 9256 Us Highway 311
- 1206 Byron Ln
- 101 Blair Dr
- 104 Autumn Hill Ct
- 118 Rand Blvd
- 9116 Us Highway 311
- 204 Aldridge Ln
- 103 Hanner Ct