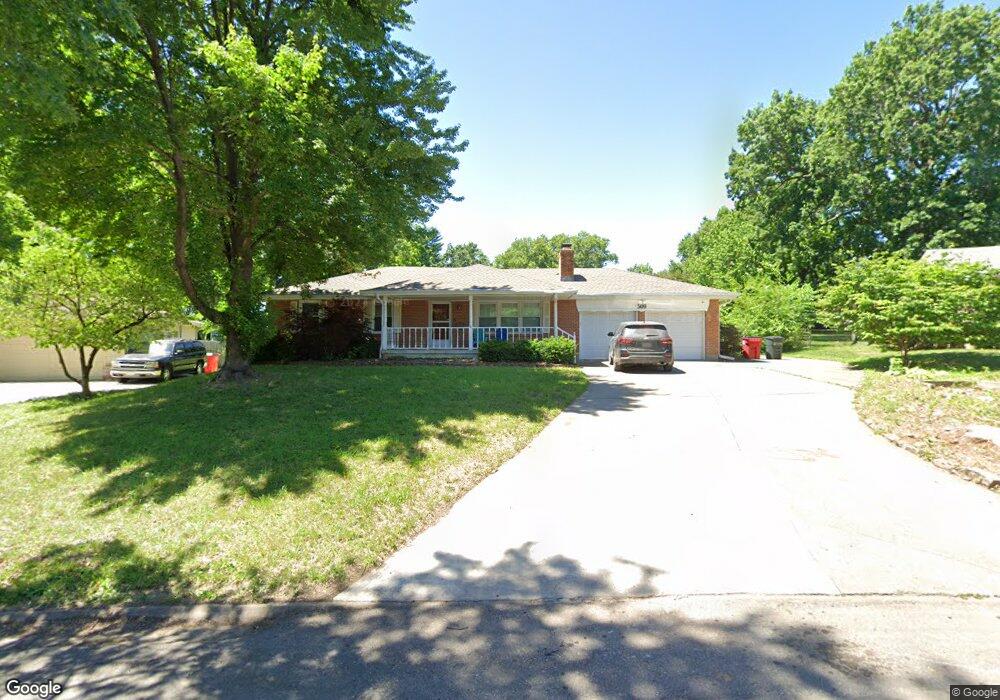
509 Rankin Rd Independence, MO 64055
Hanthorn NeighborhoodEstimated Value: $286,000 - $351,000
3
Beds
2
Baths
1,586
Sq Ft
$205/Sq Ft
Est. Value
About This Home
This home is located at 509 Rankin Rd, Independence, MO 64055 and is currently estimated at $324,754, approximately $204 per square foot. 509 Rankin Rd is a home located in Jackson County with nearby schools including Sycamore Hills Elementary School, Bridger Middle School, and Pioneer Ridge Middle School.
Ownership History
Date
Name
Owned For
Owner Type
Purchase Details
Closed on
Mar 24, 2022
Sold by
Lentz Pearl E
Bought by
Jensen Taylor Talbot and Jensen Jacob Brian
Current Estimated Value
Home Financials for this Owner
Home Financials are based on the most recent Mortgage that was taken out on this home.
Original Mortgage
$291,000
Outstanding Balance
$273,374
Interest Rate
4.42%
Mortgage Type
Balloon
Estimated Equity
$51,380
Purchase Details
Closed on
Sep 17, 2020
Sold by
Small Jeffrey A and Small Gail
Bought by
Lentz Pearl E
Purchase Details
Closed on
Feb 26, 1997
Sold by
Small Jack L and Small Kathleen E
Bought by
Small Jack L and Small Kathleen E
Create a Home Valuation Report for This Property
The Home Valuation Report is an in-depth analysis detailing your home's value as well as a comparison with similar homes in the area
Home Values in the Area
Average Home Value in this Area
Purchase History
| Date | Buyer | Sale Price | Title Company |
|---|---|---|---|
| Jensen Taylor Talbot | -- | Stewart Title Company | |
| Jensen Taylor Talbot | $387,030 | Stewart Title Company | |
| Jensen Taylor Talbot | -- | Stewart Title Company | |
| Jensen Taylor Talbot | $387,030 | Stewart Title Company | |
| Lentz Pearl E | -- | Secured Title Of Kansas City | |
| Lentz Pearl E | -- | Secured Title Of Kansas City | |
| Small Jack L | -- | -- | |
| Small Jack L | -- | -- | |
| Small Jack L | -- | -- | |
| Small Jack L | -- | -- | |
| Small Jack L | -- | -- | |
| Small Jack L | -- | -- | |
| Small Jack L | -- | -- | |
| Small Jack L | -- | -- |
Source: Public Records
Mortgage History
| Date | Status | Borrower | Loan Amount |
|---|---|---|---|
| Open | Jensen Taylor Talbot | $291,000 | |
| Closed | Jensen Taylor Talbot | $291,000 |
Source: Public Records
Tax History Compared to Growth
Tax History
| Year | Tax Paid | Tax Assessment Tax Assessment Total Assessment is a certain percentage of the fair market value that is determined by local assessors to be the total taxable value of land and additions on the property. | Land | Improvement |
|---|---|---|---|---|
| 2025 | $3,272 | $49,500 | $8,827 | $40,673 |
| 2024 | $3,198 | $47,232 | $9,109 | $38,123 |
| 2023 | $3,198 | $47,232 | $4,830 | $42,402 |
| 2022 | $2,765 | $37,430 | $9,082 | $28,348 |
| 2021 | $2,764 | $37,430 | $9,082 | $28,348 |
| 2020 | $2,480 | $32,633 | $9,082 | $23,551 |
| 2019 | $2,440 | $32,633 | $9,082 | $23,551 |
| 2018 | $784,769 | $28,047 | $5,206 | $22,841 |
| 2017 | $2,197 | $28,047 | $5,206 | $22,841 |
| 2016 | $2,059 | $26,028 | $5,871 | $20,157 |
| 2014 | $1,955 | $25,270 | $5,700 | $19,570 |
Source: Public Records
Map
Nearby Homes
- 604 Rankin Rd
- 334 E Hansen Ct
- 311 E Hansen Ct Unit 73
- 337 E Partridge Ave
- 303 E Partridge #G Ave Unit G
- 801 E Manor Rd
- 800 E Manor Rd
- 2223 S Leslie Ave
- 522 E Devon St
- 612 E Leslie Dr
- 735 E Devon St
- 633 E Leslie Dr
- 17211 E 32nd St S
- 421 E Angus St
- 1615 S Drumm Ave
- 1423 S Dodgion Ave
- 1702 S Pollard Ave
- 1815 & 1719 S Osage St
- 521 S Leslie Dr
- 1340 S Emery Ave
- 509 E Rankin Rd
- 505 Rankin Rd
- 601 Rankin Rd
- 516 Rankin Rd
- 600 Rankin Rd
- 605 Rankin Rd
- 512 Rankin Rd
- 1915 S Pearl St
- 1909 S Pearl St
- 611 Rankin Rd
- 504 Rankin Rd
- 1925 S Pearl St
- 1901 S Pearl St
- 612 Rankin Rd
- 500 Rankin Rd
- 428 E Bellevista Dr
- 420 E Bellevista Dr
- 502 Rankin Rd
- 1933 S Pearl St
- 430 E Bellevista Dr