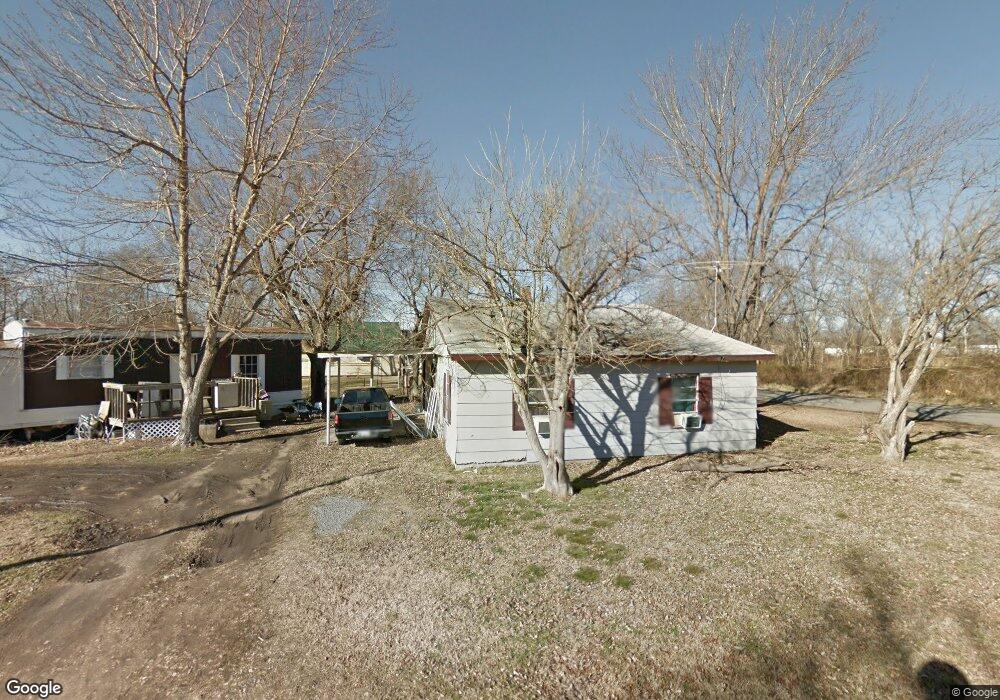
509 Roberts St Hulbert, OK 74441
Estimated Value: $50,000 - $65,502
2
Beds
1
Bath
936
Sq Ft
$62/Sq Ft
Est. Value
About This Home
This home is located at 509 Roberts St, Hulbert, OK 74441 and is currently estimated at $58,126, approximately $62 per square foot. 509 Roberts St is a home located in Cherokee County with nearby schools including Hulbert Elementary School, Hulbert Jr./Sr. High School, and Hulbert Senior High School.
Ownership History
Date
Name
Owned For
Owner Type
Purchase Details
Closed on
Mar 17, 2025
Sold by
Bailey Chester
Bought by
Hiseley Brett
Current Estimated Value
Purchase Details
Closed on
Feb 25, 2025
Sold by
Guinn Kristopher and Guinn Elisha
Bought by
Bailey Chester
Purchase Details
Closed on
May 11, 2022
Sold by
Rowe Casey L
Bought by
Bailey Chester L
Purchase Details
Closed on
May 15, 2013
Sold by
Rowe Casey L and Rowe Jacqueline Dawn
Bought by
Rowe Caset L
Purchase Details
Closed on
Jan 24, 2005
Sold by
Martin Billye R and Martin Jeannie M
Bought by
Rowe Casey L
Home Financials for this Owner
Home Financials are based on the most recent Mortgage that was taken out on this home.
Original Mortgage
$13,512
Interest Rate
5.68%
Mortgage Type
FHA
Create a Home Valuation Report for This Property
The Home Valuation Report is an in-depth analysis detailing your home's value as well as a comparison with similar homes in the area
Purchase History
| Date | Buyer | Sale Price | Title Company |
|---|---|---|---|
| Hiseley Brett | $12,000 | None Listed On Document | |
| Hiseley Brett | $12,000 | None Listed On Document | |
| Bailey Chester | -- | None Listed On Document | |
| Bailey Chester L | $5,000 | None Listed On Document | |
| Rowe Caset L | -- | None Available | |
| Rowe Casey L | $14,500 | Tahlequah Abstract Closing |
Source: Public Records
Mortgage History
| Date | Status | Borrower | Loan Amount |
|---|---|---|---|
| Previous Owner | Rowe Casey L | $13,512 |
Source: Public Records
Tax History
| Year | Tax Paid | Tax Assessment Tax Assessment Total Assessment is a certain percentage of the fair market value that is determined by local assessors to be the total taxable value of land and additions on the property. | Land | Improvement |
|---|---|---|---|---|
| 2025 | $214 | $3,021 | $373 | $2,648 |
| 2024 | $222 | $2,878 | $356 | $2,522 |
| 2023 | $222 | $2,740 | $323 | $2,417 |
| 2022 | $191 | $2,455 | $323 | $2,132 |
| 2021 | $184 | $2,338 | $323 | $2,015 |
| 2020 | $176 | $2,227 | $323 | $1,904 |
| 2019 | $170 | $2,120 | $323 | $1,797 |
| 2018 | $164 | $2,020 | $323 | $1,697 |
| 2017 | $157 | $1,923 | $323 | $1,600 |
| 2016 | $152 | $1,832 | $323 | $1,509 |
| 2015 | $121 | $1,745 | $323 | $1,422 |
| 2014 | $115 | $1,661 | $323 | $1,338 |
Source: Public Records
Map
Nearby Homes
- 516 E 5th St
- 517 S Birch St
- 518 E 5th St
- 520 E 5th St
- 210 N Birch St
- 10411 Oklahoma 51
- 7840 W Wildflower Ln
- 18411 S Lake Region Rd
- 7809 Teague
- 16373 N Grace Hudlen Rd
- 17488 N Vaughn Rd
- 18020 S Vaughn Rd
- 18030 S Vaughn Rd
- 11261 Highway 51
- 0 W Hwy 51 Unit 2510742
- 19867 S 410 Rd
- 16100 E 640
- 13068 N 418 Rd
- 5452 W 730 Rd
- 16454 N Fred Smith Rd
Your Personal Tour Guide
Ask me questions while you tour the home.