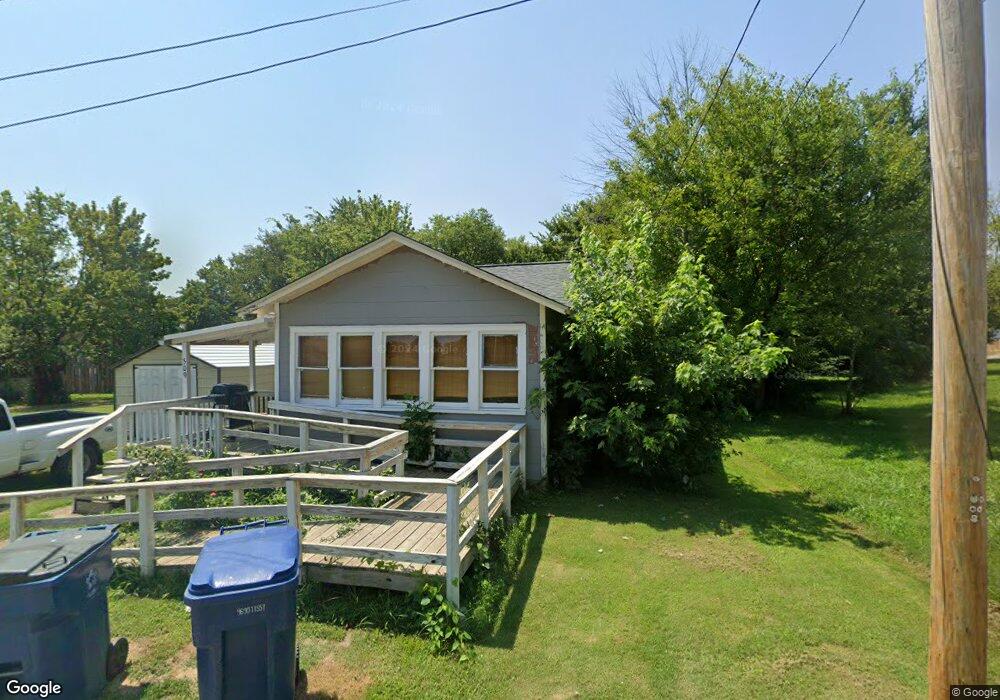
509 S 21st St Mount Vernon, IL 62864
Estimated Value: $42,000 - $65,000
2
Beds
1
Bath
964
Sq Ft
$55/Sq Ft
Est. Value
About This Home
This home is located at 509 S 21st St, Mount Vernon, IL 62864 and is currently estimated at $53,174, approximately $55 per square foot. 509 S 21st St is a home located in Jefferson County with nearby schools including J.L. Buford Intermediate Education Center, Osborne Primary Center, and Zadok Casey Middle School.
Ownership History
Date
Name
Owned For
Owner Type
Purchase Details
Closed on
Jun 18, 2020
Sold by
Texico Llc
Bought by
Williams Daniel R and Mccall Karen A
Current Estimated Value
Purchase Details
Closed on
Sep 29, 2010
Sold by
Texico State Bank
Bought by
Texico Llc
Purchase Details
Closed on
Oct 7, 2009
Sold by
Texico State Bank
Bought by
Williams Daniel R and Mccall Karen A
Purchase Details
Closed on
Nov 12, 2008
Sold by
Rowe Jennifer
Bought by
Texico State Bank
Purchase Details
Closed on
Oct 20, 2008
Sold by
Rowe Jennifer
Bought by
Texico State Bank
Purchase Details
Closed on
Sep 7, 2007
Sold by
Rowe Michael
Bought by
Rowe Jennifer
Create a Home Valuation Report for This Property
The Home Valuation Report is an in-depth analysis detailing your home's value as well as a comparison with similar homes in the area
Home Values in the Area
Average Home Value in this Area
Purchase History
| Date | Buyer | Sale Price | Title Company |
|---|---|---|---|
| Williams Daniel R | $19,900 | None Available | |
| Texico Llc | $23,000 | None Available | |
| Williams Daniel R | -- | None Available | |
| Texico State Bank | -- | None Available | |
| Texico State Bank | $24,000 | None Available | |
| Rowe Jennifer | -- | None Available |
Source: Public Records
Tax History Compared to Growth
Tax History
| Year | Tax Paid | Tax Assessment Tax Assessment Total Assessment is a certain percentage of the fair market value that is determined by local assessors to be the total taxable value of land and additions on the property. | Land | Improvement |
|---|---|---|---|---|
| 2024 | $290 | $9,338 | $2,676 | $6,662 |
| 2023 | $276 | $8,620 | $2,470 | $6,150 |
| 2022 | $298 | $7,562 | $2,167 | $5,395 |
| 2021 | $304 | $7,202 | $2,064 | $5,138 |
| 2020 | $311 | $6,731 | $1,929 | $4,802 |
| 2019 | $307 | $6,731 | $1,929 | $4,802 |
| 2018 | $305 | $6,731 | $1,929 | $4,802 |
| 2017 | $600 | $12,030 | $1,929 | $10,101 |
| 2016 | $585 | $12,030 | $1,929 | $10,101 |
| 2015 | $573 | $12,030 | $1,929 | $10,101 |
| 2014 | $941 | $12,030 | $1,929 | $10,101 |
| 2013 | $941 | $11,349 | $1,820 | $9,529 |
Source: Public Records
Map
Nearby Homes