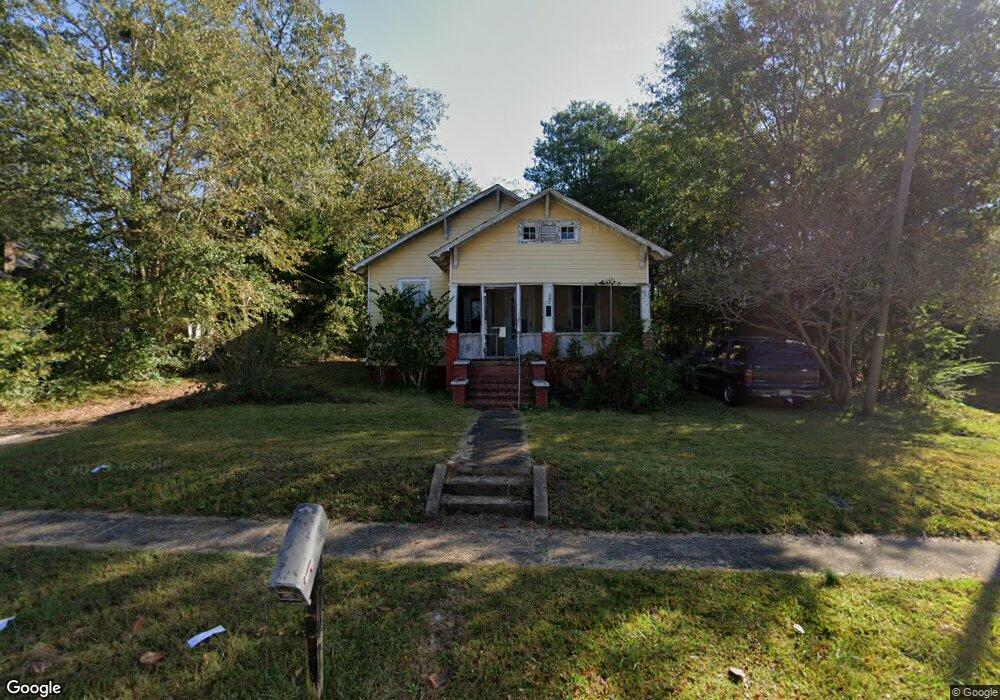
509 S Lee St Lagrange, GA 30240
Estimated Value: $51,000 - $117,000
3
Beds
1
Bath
1,124
Sq Ft
$71/Sq Ft
Est. Value
About This Home
This home is located at 509 S Lee St, Lagrange, GA 30240 and is currently estimated at $80,080, approximately $71 per square foot. 509 S Lee St is a home located in Troup County with nearby schools including Ethel W. Kight Elementary School, Hollis Hand Elementary School, and Franklin Forest Elementary School.
Ownership History
Date
Name
Owned For
Owner Type
Purchase Details
Closed on
Aug 14, 2019
Sold by
Garcia Christian
Bought by
Render Wanda
Current Estimated Value
Purchase Details
Closed on
Dec 1, 2017
Sold by
Wyatt Robert
Bought by
Garcia Christian
Purchase Details
Closed on
Aug 24, 1987
Sold by
Davis Flora
Bought by
Wyatt Robert Steven and Wyatt Virgina
Purchase Details
Closed on
Apr 30, 1965
Sold by
First Federal Savings & Loan
Bought by
Davis Flora
Purchase Details
Closed on
Mar 1, 1951
Sold by
Callaway Community Fdn
Bought by
First Federal Savings & Loan
Create a Home Valuation Report for This Property
The Home Valuation Report is an in-depth analysis detailing your home's value as well as a comparison with similar homes in the area
Purchase History
| Date | Buyer | Sale Price | Title Company |
|---|---|---|---|
| Render Wanda | $30,000 | -- | |
| Garcia Christian | $34,000 | -- | |
| Wyatt Robert Steven | $22,000 | -- | |
| Davis Flora | -- | -- | |
| First Federal Savings & Loan | -- | -- |
Source: Public Records
Tax History
| Year | Tax Paid | Tax Assessment Tax Assessment Total Assessment is a certain percentage of the fair market value that is determined by local assessors to be the total taxable value of land and additions on the property. | Land | Improvement |
|---|---|---|---|---|
| 2025 | $589 | $26,240 | $4,040 | $22,200 |
| 2024 | $589 | $21,600 | $4,040 | $17,560 |
| 2023 | $544 | $19,960 | $4,040 | $15,920 |
| 2022 | $527 | $18,880 | $4,040 | $14,840 |
| 2021 | $491 | $16,280 | $4,040 | $12,240 |
| 2020 | $362 | $16,280 | $4,040 | $12,240 |
| 2019 | $410 | $15,440 | $4,040 | $11,400 |
| 2018 | $511 | $16,940 | $3,900 | $13,040 |
| 2017 | $511 | $16,940 | $3,900 | $13,040 |
| 2016 | $505 | $16,749 | $3,900 | $12,849 |
| 2015 | $511 | $16,899 | $4,050 | $12,849 |
| 2014 | $491 | $16,223 | $4,050 | $12,173 |
| 2013 | -- | $17,581 | $4,056 | $13,525 |
Source: Public Records
Map
Nearby Homes
- 507 S Lee St
- 517 Jefferson St
- 503 S Lee St
- 133 Garfield St
- 202 Parker Ln
- 109 Garfield St
- 610 Wilburn Ave
- 608 Wilburn Ave
- 211 Moores Hill
- 0 Moores Hill
- 107 Clark St
- 1518 Brownwood Ave
- 217 Jefferson St
- 0 N Lee St Unit 10550825
- 812 Elm St
- 600 Park Ave
- 1304 Forrest Ave
- 1405 Forrest Ave
- 1402 Forrest Ave
- 102 Crown St Unit LOT 1
Your Personal Tour Guide
Ask me questions while you tour the home.