509 S Main St Payson, UT 84651
Estimated Value: $421,000 - $492,000
4
Beds
2
Baths
2,203
Sq Ft
$210/Sq Ft
Est. Value
About This Home
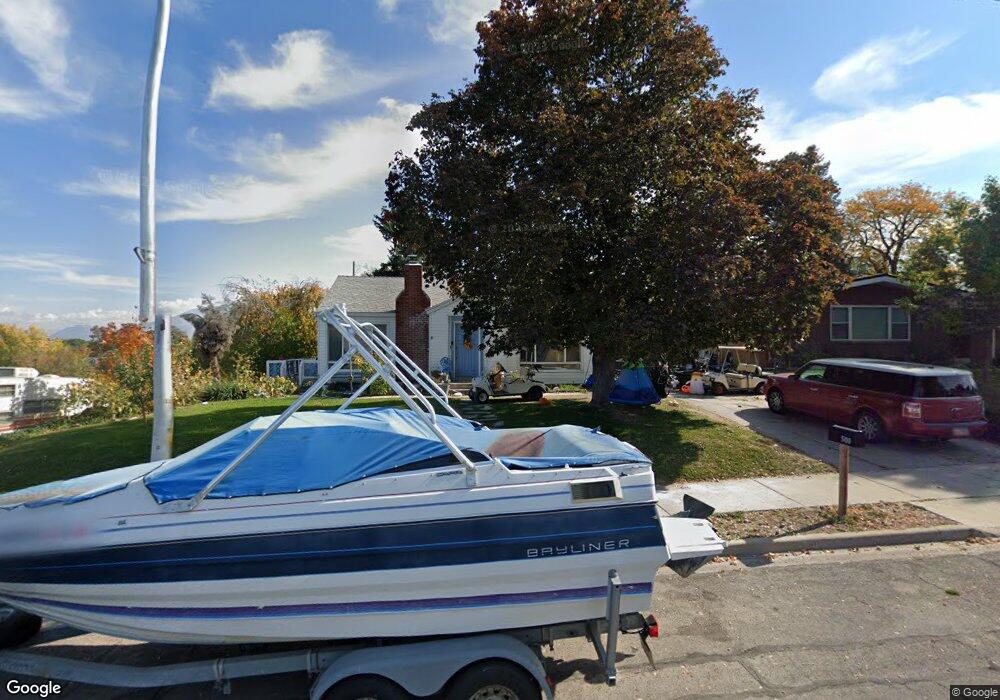
This home is located at 509 S Main St, Payson, UT 84651 and is currently estimated at $461,884, approximately $209 per square foot. 509 S Main St is a home located in Utah County with nearby schools including Park View Elementary, Payson Junior High School, and Payson High School.
Ownership History
Date
Name
Owned For
Owner Type
Purchase Details
Closed on
Nov 9, 2011
Sold by
Giffing Robert and Giffing Monica
Bought by
Murray Jason and Murray Robin
Current Estimated Value
Home Financials for this Owner
Home Financials are based on the most recent Mortgage that was taken out on this home.
Original Mortgage
$134,900
Outstanding Balance
$98,137
Interest Rate
3.95%
Mortgage Type
Purchase Money Mortgage
Estimated Equity
$363,747
Purchase Details
Closed on
Feb 16, 2006
Sold by
Hillman Loraine N
Bought by
Giffing Robert and Giffing Monica
Home Financials for this Owner
Home Financials are based on the most recent Mortgage that was taken out on this home.
Original Mortgage
$138,821
Interest Rate
6.04%
Mortgage Type
FHA
Purchase Details
Closed on
Jul 26, 1999
Sold by
Nielsen Dorothy Daley
Bought by
Nielsen Dorothy Isabell Daley
Create a Home Valuation Report for This Property
The Home Valuation Report is an in-depth analysis detailing your home's value as well as a comparison with similar homes in the area
Home Values in the Area
Average Home Value in this Area
Purchase History
| Date | Buyer | Sale Price | Title Company |
|---|---|---|---|
| Murray Jason | -- | Pro Title & Escrow Inc | |
| Giffing Robert | -- | Backman Title Services Ltd | |
| Nielsen Dorothy Isabell Daley | -- | -- |
Source: Public Records
Mortgage History
| Date | Status | Borrower | Loan Amount |
|---|---|---|---|
| Open | Murray Jason | $134,900 | |
| Previous Owner | Giffing Robert | $138,821 |
Source: Public Records
Tax History
| Year | Tax Paid | Tax Assessment Tax Assessment Total Assessment is a certain percentage of the fair market value that is determined by local assessors to be the total taxable value of land and additions on the property. | Land | Improvement |
|---|---|---|---|---|
| 2025 | $1,967 | $217,635 | -- | -- |
| 2024 | $1,967 | $200,145 | $0 | $0 |
| 2023 | $1,961 | $200,090 | $0 | $0 |
| 2022 | $2,052 | $205,920 | $0 | $0 |
| 2021 | $1,712 | $275,600 | $100,000 | $175,600 |
| 2020 | $1,631 | $256,900 | $90,900 | $166,000 |
| 2019 | $1,393 | $225,000 | $78,500 | $146,500 |
| 2018 | $1,247 | $194,000 | $66,100 | $127,900 |
| 2017 | $1,149 | $96,140 | $0 | $0 |
| 2016 | $1,022 | $84,975 | $0 | $0 |
| 2015 | $985 | $81,345 | $0 | $0 |
| 2014 | $899 | $74,745 | $0 | $0 |
Source: Public Records
Map
Nearby Homes
Your Personal Tour Guide
Ask me questions while you tour the home.