509 S Main St Sullivan, IN 47882
Estimated Value: $146,000 - $203,275
3
Beds
2
Baths
1,772
Sq Ft
$102/Sq Ft
Est. Value
About This Home
This home is located at 509 S Main St, Sullivan, IN 47882 and is currently estimated at $181,319, approximately $102 per square foot. 509 S Main St is a home located in Sullivan County with nearby schools including Sullivan High School.
Ownership History
Date
Name
Owned For
Owner Type
Purchase Details
Closed on
Sep 26, 2022
Sold by
Clearwater Investment Properties Llc
Bought by
Wagaman Brian M and Wagaman Amy L
Current Estimated Value
Home Financials for this Owner
Home Financials are based on the most recent Mortgage that was taken out on this home.
Original Mortgage
$148,000
Outstanding Balance
$141,918
Interest Rate
5.55%
Mortgage Type
New Conventional
Estimated Equity
$39,401
Purchase Details
Closed on
Mar 31, 2022
Sold by
City Of Sullivan Redevelopment Commissio
Bought by
Clearwater Investment Properties Llc
Purchase Details
Closed on
Feb 22, 2021
Sold by
Vinod C Gupta For Indyre Llc
Bought by
City Of Sullivan Redevelopment Commissio
Purchase Details
Closed on
Feb 18, 2019
Sold by
Sullivan County Auditor
Bought by
Savvy In Llc
Create a Home Valuation Report for This Property
The Home Valuation Report is an in-depth analysis detailing your home's value as well as a comparison with similar homes in the area
Home Values in the Area
Average Home Value in this Area
Purchase History
| Date | Buyer | Sale Price | Title Company |
|---|---|---|---|
| Wagaman Brian M | -- | -- | |
| Clearwater Investment Properties Llc | -- | None Listed On Document | |
| City Of Sullivan Redevelopment Commissio | -- | None Available | |
| Savvy In Llc | $1,791 | None Available |
Source: Public Records
Mortgage History
| Date | Status | Borrower | Loan Amount |
|---|---|---|---|
| Open | Wagaman Brian M | $148,000 |
Source: Public Records
Tax History Compared to Growth
Tax History
| Year | Tax Paid | Tax Assessment Tax Assessment Total Assessment is a certain percentage of the fair market value that is determined by local assessors to be the total taxable value of land and additions on the property. | Land | Improvement |
|---|---|---|---|---|
| 2024 | $1,771 | $99,100 | $5,300 | $93,800 |
| 2023 | $1,771 | $85,500 | $5,300 | $80,200 |
| 2022 | $106 | $5,300 | $5,300 | $0 |
| 2021 | $766 | $38,300 | $5,300 | $33,000 |
| 2020 | $766 | $38,300 | $5,300 | $33,000 |
| 2019 | $766 | $38,300 | $5,300 | $33,000 |
| 2018 | $766 | $38,300 | $5,300 | $33,000 |
| 2017 | $758 | $37,900 | $5,300 | $32,600 |
| 2016 | $758 | $37,900 | $5,300 | $32,600 |
| 2014 | -- | $36,900 | $5,300 | $31,600 |
| 2013 | -- | $35,200 | $5,300 | $29,900 |
Source: Public Records
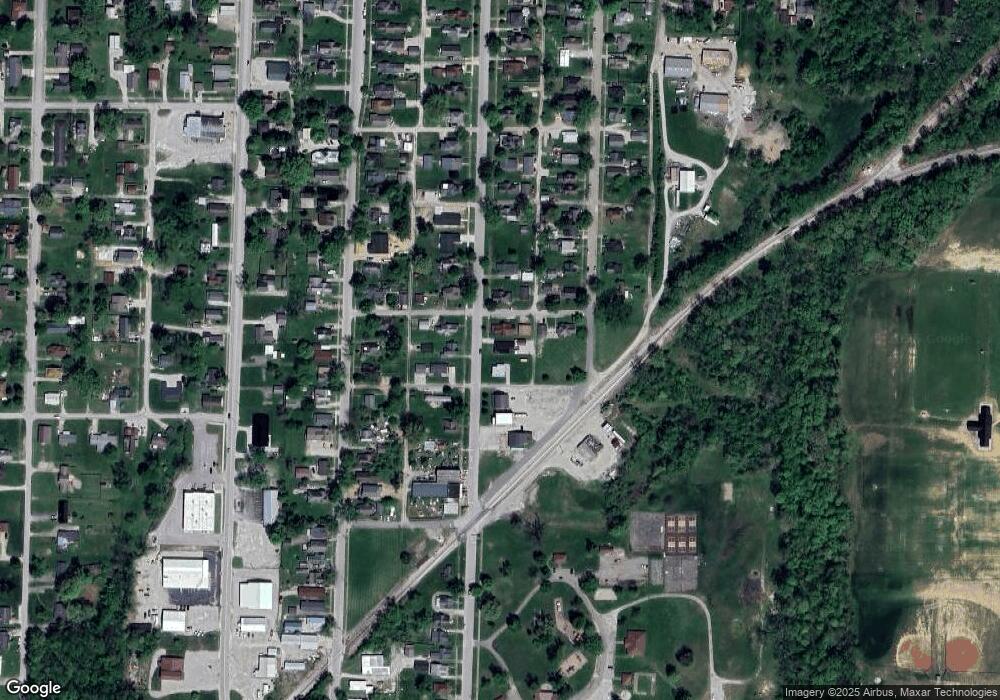
Map
Nearby Homes
- 324 S State St
- 302 S Court St
- 562 S Court St
- 237 S Main St
- 301 S Section St
- 245 S State St
- 221 S State St
- 442 S Troll St
- 209 E Jackson St
- 682 E Pr Rd 265 N
- 403 W Sylvandell St
- 241 W Washington St
- 206 W Washington St
- 314 E Washington St
- 316 E Washington St
- 312 E Washington St
- 320 E Washington St
- 318 E Washington St
- 524 W Sylvandell St
- 319 E Wall St