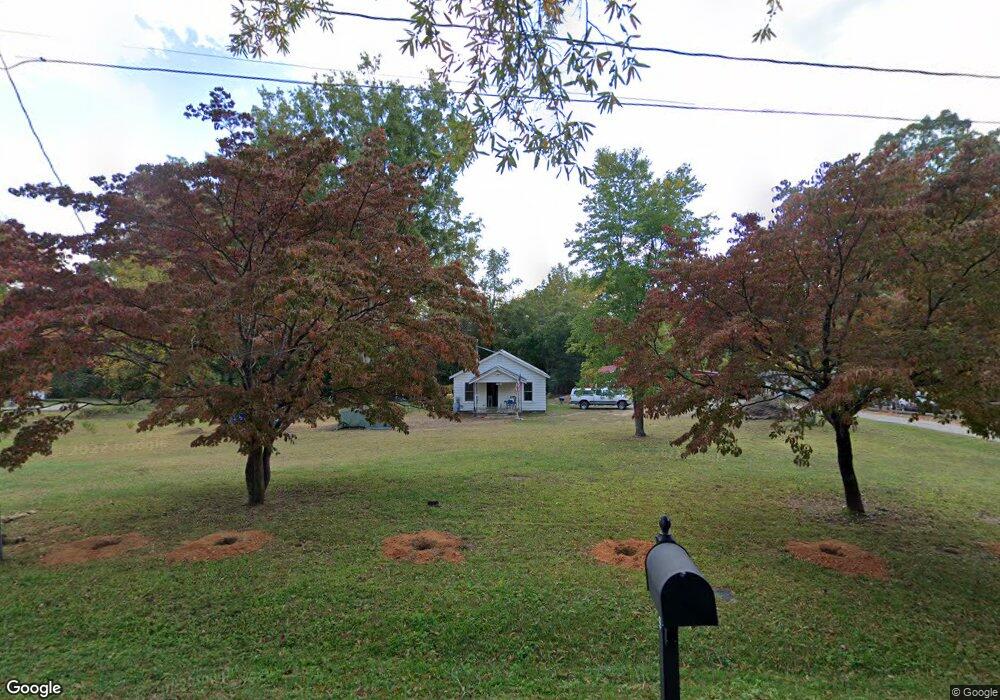
509 Snow St Kannapolis, NC 28081
Estimated Value: $184,000 - $219,000
2
Beds
1
Bath
920
Sq Ft
$215/Sq Ft
Est. Value
About This Home
This home is located at 509 Snow St, Kannapolis, NC 28081 and is currently estimated at $197,424, approximately $214 per square foot. 509 Snow St is a home located in Rowan County with nearby schools including Landis Elementary School, Corriher Lipe Middle School, and South Rowan High School.
Ownership History
Date
Name
Owned For
Owner Type
Purchase Details
Closed on
Feb 3, 2017
Sold by
Fesperman Andy Lynn and Fesperman Sandra Weatherman
Bought by
Getsi Michael Christopher
Current Estimated Value
Purchase Details
Closed on
Oct 15, 2014
Bought by
Getsi Michael Christopher
Purchase Details
Closed on
Sep 15, 2005
Sold by
Mecimore Carl A and Mecimore Carolyn
Bought by
Noonan Denise Jane
Home Financials for this Owner
Home Financials are based on the most recent Mortgage that was taken out on this home.
Original Mortgage
$60,000
Interest Rate
5.77%
Mortgage Type
Fannie Mae Freddie Mac
Purchase Details
Closed on
Oct 21, 2004
Sold by
Mecimore Carl A and Mecimore Carolyn
Bought by
Weaver Robert F and Weaver Connie F
Create a Home Valuation Report for This Property
The Home Valuation Report is an in-depth analysis detailing your home's value as well as a comparison with similar homes in the area
Home Values in the Area
Average Home Value in this Area
Purchase History
| Date | Buyer | Sale Price | Title Company |
|---|---|---|---|
| Getsi Michael Christopher | $12,000 | None Available | |
| Getsi Michael Christopher | -- | -- | |
| Noonan Denise Jane | $60,000 | -- | |
| Weaver Robert F | -- | -- | |
| Fesperman Andy Lynn | -- | -- |
Source: Public Records
Mortgage History
| Date | Status | Borrower | Loan Amount |
|---|---|---|---|
| Previous Owner | Noonan Denise Jane | $60,000 |
Source: Public Records
Tax History Compared to Growth
Tax History
| Year | Tax Paid | Tax Assessment Tax Assessment Total Assessment is a certain percentage of the fair market value that is determined by local assessors to be the total taxable value of land and additions on the property. | Land | Improvement |
|---|---|---|---|---|
| 2025 | $1,547 | $127,874 | $39,150 | $88,724 |
| 2024 | $1,547 | $127,874 | $39,150 | $88,724 |
| 2023 | $1,547 | $127,874 | $39,150 | $88,724 |
| 2022 | $1,263 | $98,094 | $33,930 | $64,164 |
| 2021 | $1,263 | $98,094 | $33,930 | $64,164 |
| 2020 | $879 | $68,301 | $25,317 | $42,984 |
| 2019 | $879 | $68,301 | $25,317 | $42,984 |
| 2018 | $773 | $60,694 | $25,277 | $35,417 |
| 2017 | $683 | $53,623 | $18,206 | $35,417 |
| 2016 | $683 | $53,623 | $18,206 | $35,417 |
| 2015 | $693 | $53,623 | $18,206 | $35,417 |
| 2014 | $690 | $55,168 | $18,206 | $36,962 |
Source: Public Records
Map
Nearby Homes
- 0 Vale Ave
- 515 Rosemont Ave
- 2885 Vale Ave
- 2401 Brookview Ave
- 2909 Glendale Ave
- 0 Summit Ave
- 391 Copes Ct
- 843 Fairway Dr Unit 44
- 2003 Plaza Ave
- Lot 2 Leazer St Unit 2
- Lot 1 Leazer St Unit 1
- 531 Sand Dunes Dr
- 513 Sand Dunes Dr
- 519 Sand Dunes Dr
- 107 W 21st St
- 859 Irish Creek Dr
- 2274 Tullymore Dr Unit 14
- 227 W 18th St
- 221 W 18th St
- 239 W 18th St