Estimated Value: $283,000 - $303,268
4
Beds
3
Baths
2,230
Sq Ft
$132/Sq Ft
Est. Value
About This Home
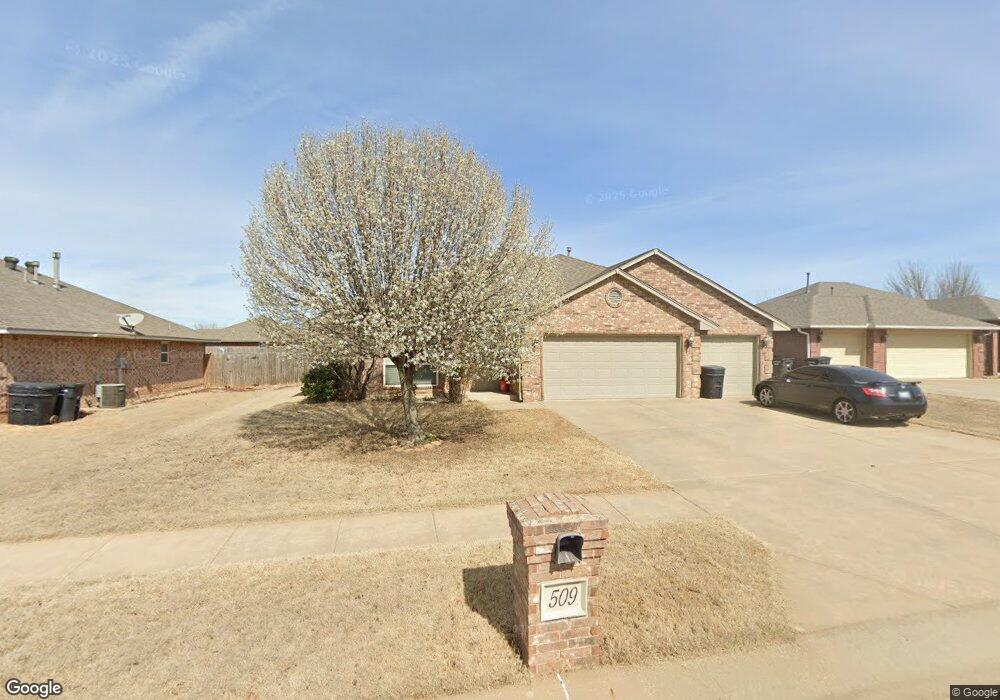
This home is located at 509 SW 39th St, Moore, OK 73160 and is currently estimated at $294,317, approximately $131 per square foot. 509 SW 39th St is a home located in Cleveland County with nearby schools including Broadmoore Elementary School, Highland East Junior High School, and Moore High School.
Ownership History
Date
Name
Owned For
Owner Type
Purchase Details
Closed on
Oct 31, 2013
Sold by
Wiggs Clifford L and Wiggs Tiffany
Bought by
Lull George L
Current Estimated Value
Home Financials for this Owner
Home Financials are based on the most recent Mortgage that was taken out on this home.
Original Mortgage
$180,000
Outstanding Balance
$132,496
Interest Rate
4.29%
Mortgage Type
VA
Estimated Equity
$161,821
Purchase Details
Closed on
Nov 30, 2006
Sold by
Colony Homes Inc
Bought by
Wiggs Clifford L and Wiggs Tiffany
Create a Home Valuation Report for This Property
The Home Valuation Report is an in-depth analysis detailing your home's value as well as a comparison with similar homes in the area
Home Values in the Area
Average Home Value in this Area
Purchase History
| Date | Buyer | Sale Price | Title Company |
|---|---|---|---|
| Lull George L | $180,000 | Fatco | |
| Wiggs Clifford L | $206,000 | None Available |
Source: Public Records
Mortgage History
| Date | Status | Borrower | Loan Amount |
|---|---|---|---|
| Open | Lull George L | $180,000 |
Source: Public Records
Tax History
| Year | Tax Paid | Tax Assessment Tax Assessment Total Assessment is a certain percentage of the fair market value that is determined by local assessors to be the total taxable value of land and additions on the property. | Land | Improvement |
|---|---|---|---|---|
| 2025 | $3,678 | $30,032 | $4,119 | $25,913 |
| 2023 | $3,320 | $27,240 | $3,721 | $23,519 |
| 2022 | $3,210 | $25,943 | $4,352 | $21,591 |
| 2021 | $3,070 | $24,707 | $4,284 | $20,423 |
| 2020 | $2,925 | $23,531 | $3,230 | $20,301 |
| 2019 | $2,837 | $22,410 | $3,085 | $19,325 |
| 2018 | $2,702 | $21,344 | $2,640 | $18,704 |
| 2017 | $2,717 | $21,344 | $0 | $0 |
| 2016 | $2,736 | $21,344 | $2,640 | $18,704 |
| 2015 | $2,511 | $21,643 | $2,626 | $19,017 |
| 2014 | $2,448 | $20,612 | $2,640 | $17,972 |
Source: Public Records
Map
Nearby Homes
- 4008 Red Apple Cir
- 601 SW 38th Place
- 508 SW 38th Terrace
- 3616 Green Apple Place
- 4237 Syracuse St
- 0 S Eastern Ave
- 4405 Apple Blossom Cir
- 708 Carol Ann Place
- 4413 Boardwalk Ave
- 917 SW 37th St Unit 919
- 208 SW 32nd St
- 620 Apple Tree Ln
- 3800 Kensington Dr
- 3900 Notting Hill Dr
- 3604 Necia St
- 3501 Necia St
- 101 SW 41st St
- 3209 SE 33rd St
- 2909 Broadway Terrace
- 308 Jeffrey Laird Place
- 513 SW 39th St
- 505 SW 39th St
- 522 SW 38th Terrace
- 517 SW 39th St
- 3621 Liberty Dr
- 4001 Red Apple Terrace
- 501 SW 39th St
- 4000 Red Apple Cir
- 520 SW 38th Terrace
- 519 SW 39th St
- 3619 Liberty Dr
- 4000 Red Apple Terrace
- 604 SW 38th Place
- 516 SW 38th Terrace
- 4005 Red Apple Terrace
- 4004 Red Apple Cir
- 4004 Red Apple Terrace
- 521 SW 39th St
- 512 SW 38th Terrace
- 3617 Liberty Dr
Your Personal Tour Guide
Ask me questions while you tour the home.