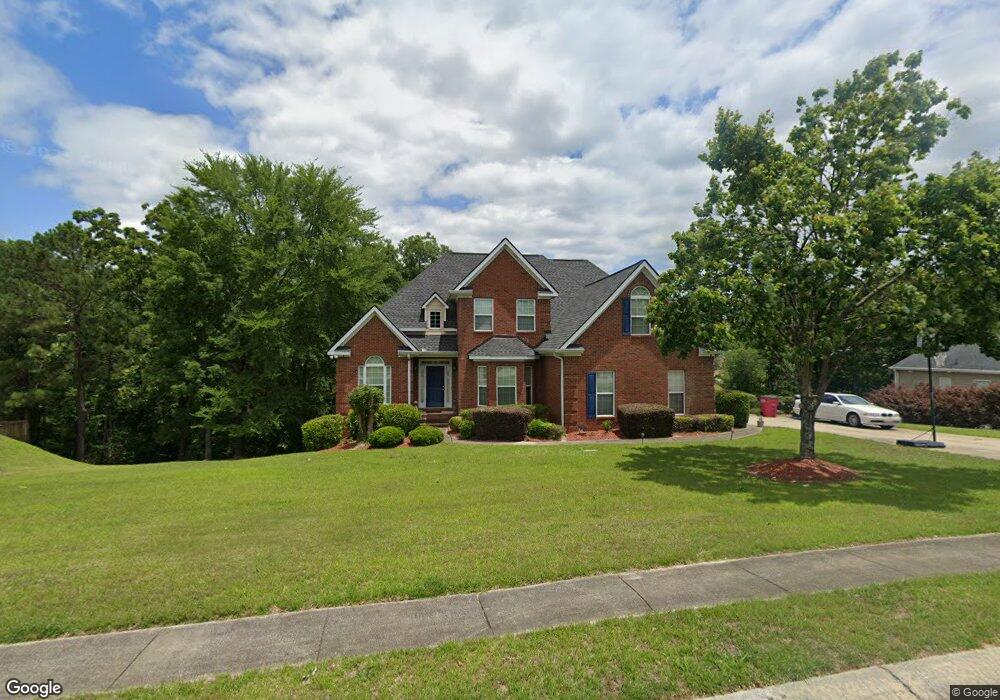
509 Thomaston Overlook Dr Macon, GA 31220
Estimated Value: $283,000 - $504,000
4
Beds
4
Baths
2,861
Sq Ft
$135/Sq Ft
Est. Value
About This Home
This home is located at 509 Thomaston Overlook Dr, Macon, GA 31220 and is currently estimated at $386,722, approximately $135 per square foot. 509 Thomaston Overlook Dr is a home located in Bibb County with nearby schools including Heritage Elementary School, Weaver Middle School, and Westside High School.
Ownership History
Date
Name
Owned For
Owner Type
Purchase Details
Closed on
Aug 5, 2011
Sold by
Belk Melissa Bryant and Belk Andrew Terry
Bought by
Sewell Joseph L
Current Estimated Value
Home Financials for this Owner
Home Financials are based on the most recent Mortgage that was taken out on this home.
Original Mortgage
$219,622
Outstanding Balance
$151,332
Interest Rate
4.62%
Mortgage Type
VA
Estimated Equity
$235,390
Purchase Details
Closed on
Jul 22, 2011
Sold by
Branch Banking And Trust Company
Bought by
Southern Pine Plantations Commercial Gro
Home Financials for this Owner
Home Financials are based on the most recent Mortgage that was taken out on this home.
Original Mortgage
$219,622
Outstanding Balance
$151,332
Interest Rate
4.62%
Mortgage Type
VA
Estimated Equity
$235,390
Purchase Details
Closed on
Aug 6, 2004
Bought by
Belk Melissa and Belk Andrew
Purchase Details
Closed on
Mar 23, 2004
Create a Home Valuation Report for This Property
The Home Valuation Report is an in-depth analysis detailing your home's value as well as a comparison with similar homes in the area
Home Values in the Area
Average Home Value in this Area
Purchase History
| Date | Buyer | Sale Price | Title Company |
|---|---|---|---|
| Sewell Joseph L | $215,000 | None Available | |
| Southern Pine Plantations Commercial Gro | -- | None Available | |
| Belk Melissa | $277,500 | -- | |
| -- | $82,500 | -- |
Source: Public Records
Mortgage History
| Date | Status | Borrower | Loan Amount |
|---|---|---|---|
| Open | Sewell Joseph L | $219,622 |
Source: Public Records
Tax History Compared to Growth
Tax History
| Year | Tax Paid | Tax Assessment Tax Assessment Total Assessment is a certain percentage of the fair market value that is determined by local assessors to be the total taxable value of land and additions on the property. | Land | Improvement |
|---|---|---|---|---|
| 2025 | $194 | $129,715 | $8,000 | $121,715 |
| 2024 | $323 | $129,715 | $8,000 | $121,715 |
| 2023 | $41 | $129,610 | $8,000 | $121,610 |
| 2022 | $310 | $110,718 | $9,400 | $101,318 |
| 2021 | $3,669 | $96,562 | $8,460 | $88,102 |
| 2020 | $3,477 | $96,562 | $8,460 | $88,102 |
| 2019 | $3,204 | $88,853 | $8,460 | $80,393 |
| 2018 | $4,524 | $79,466 | $8,460 | $71,006 |
| 2017 | $2,715 | $79,466 | $8,460 | $71,006 |
| 2016 | $2,507 | $79,466 | $8,460 | $71,006 |
| 2015 | $3,549 | $79,466 | $8,460 | $71,006 |
| 2014 | $3,846 | $85,398 | $8,930 | $76,468 |
Source: Public Records
Map
Nearby Homes
- 605 Dodds Walk
- 116 Nautica Point
- 242 York Ln
- 104 Meadow Wood Dr
- 202 Lochwolde Dr
- 304 Mccleary Ln
- 308 Mccleary Ln
- 305 Mccleary Ln
- 123 Harbor Dr
- 141 Harbor Dr
- 147 Harbor Dr
- 159 Harbor Dr
- 153 Harbor Dr
- 165 Harbor Dr
- BEAUMONT Plan at Lochwolde
- ROANOKE Plan at Lochwolde
- BRISCOE Plan at Lochwolde
- 176 Kinsale Dr
- 178 Kinsale Dr
- 505 Thomaston Overlook Dr
- 515 Thomaston Overlook Dr
- 312 Scarlet Oaks Dr
- 512 Thomaston Overlook Dr
- 501 Thomaston Overlook Dr
- 519 Thomaston Overlook Dr
- 316 Scarlet Oaks Dr
- 602 Dodds Walk
- 310 Scarlet Oaks Dr
- 516 Thomaston Overlook Dr
- 320 Scarlet Oaks Dr
- 5 VACANT LOTS Scarlet Oaks Dr
- 306 Scarlet Oaks Dr
- 522 Thomaston Overlook Dr
- 523 Thomaston Overlook Dr
- 520 Thomaston Overlook Dr
- 322 Scarlet Oaks Dr
- 606 Dodds Walk
- 315 Scarlet Oaks Dr
- 302 Scarlet Oaks Dr