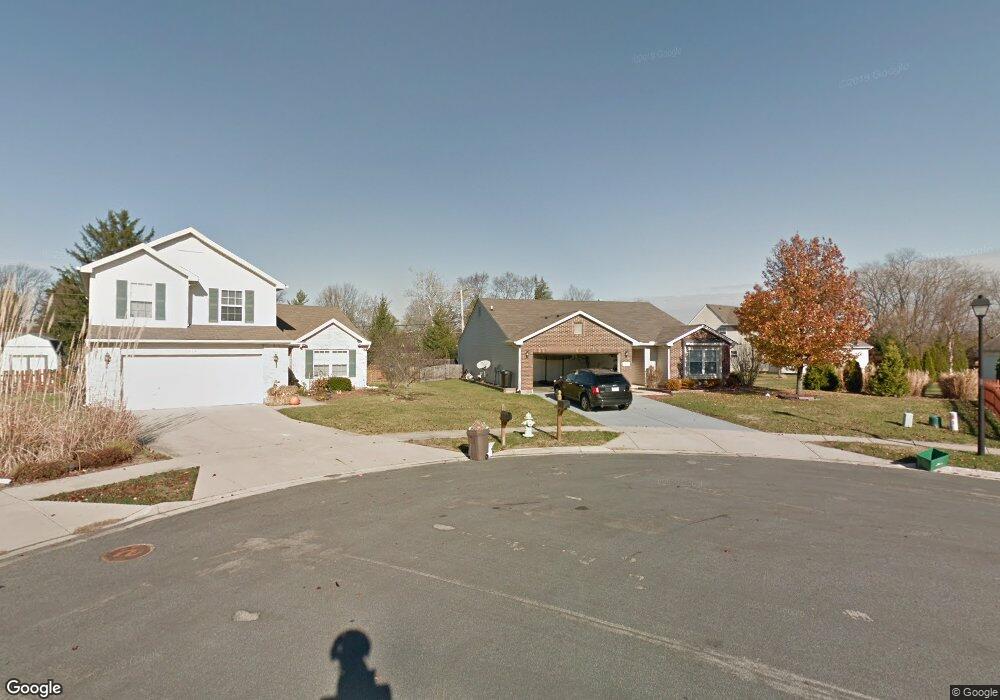
509 Thompson Dr Fairborn, OH 45324
Estimated Value: $279,785 - $300,000
3
Beds
2
Baths
1,718
Sq Ft
$170/Sq Ft
Est. Value
About This Home
This home is located at 509 Thompson Dr, Fairborn, OH 45324 and is currently estimated at $291,696, approximately $169 per square foot. 509 Thompson Dr is a home located in Greene County with nearby schools including Fairborn Primary School, Fairborn Intermediate School, and Fairborn Middle School.
Ownership History
Date
Name
Owned For
Owner Type
Purchase Details
Closed on
Oct 24, 2008
Sold by
Fannie Mae
Bought by
Roberts Danielle L
Current Estimated Value
Home Financials for this Owner
Home Financials are based on the most recent Mortgage that was taken out on this home.
Original Mortgage
$159,555
Interest Rate
6.49%
Mortgage Type
FHA
Purchase Details
Closed on
May 22, 2008
Sold by
Coffield Susan
Bought by
Federal National Mortgage Association
Purchase Details
Closed on
Nov 28, 2005
Sold by
Willis Shawn M and Willis Amy L
Bought by
Coffield Susan
Home Financials for this Owner
Home Financials are based on the most recent Mortgage that was taken out on this home.
Original Mortgage
$168,900
Interest Rate
6.2%
Mortgage Type
Fannie Mae Freddie Mac
Purchase Details
Closed on
Feb 25, 2003
Sold by
Crossmann Communities Of Ohio Inc
Bought by
Willis Shawn M and Willis Amy L
Home Financials for this Owner
Home Financials are based on the most recent Mortgage that was taken out on this home.
Original Mortgage
$143,188
Interest Rate
5.76%
Mortgage Type
FHA
Create a Home Valuation Report for This Property
The Home Valuation Report is an in-depth analysis detailing your home's value as well as a comparison with similar homes in the area
Home Values in the Area
Average Home Value in this Area
Purchase History
| Date | Buyer | Sale Price | Title Company |
|---|---|---|---|
| Roberts Danielle L | $152,000 | Accutitle Agency Inc | |
| Federal National Mortgage Association | $114,000 | None Available | |
| Coffield Susan | $168,900 | -- | |
| Willis Shawn M | $144,400 | -- |
Source: Public Records
Mortgage History
| Date | Status | Borrower | Loan Amount |
|---|---|---|---|
| Previous Owner | Roberts Danielle L | $159,555 | |
| Previous Owner | Coffield Susan | $168,900 | |
| Previous Owner | Willis Shawn M | $143,188 |
Source: Public Records
Tax History
| Year | Tax Paid | Tax Assessment Tax Assessment Total Assessment is a certain percentage of the fair market value that is determined by local assessors to be the total taxable value of land and additions on the property. | Land | Improvement |
|---|---|---|---|---|
| 2025 | $3,609 | $74,820 | $18,800 | $56,020 |
| 2024 | $3,609 | $74,820 | $18,800 | $56,020 |
| 2023 | $3,583 | $74,820 | $18,800 | $56,020 |
| 2022 | $3,335 | $58,630 | $13,430 | $45,200 |
| 2021 | $3,385 | $58,630 | $13,430 | $45,200 |
| 2020 | $3,402 | $58,630 | $13,430 | $45,200 |
| 2019 | $2,983 | $50,260 | $10,550 | $39,710 |
| 2018 | $2,944 | $50,260 | $10,550 | $39,710 |
| 2017 | $2,970 | $50,260 | $10,550 | $39,710 |
| 2016 | $2,970 | $50,680 | $10,550 | $40,130 |
| 2015 | $2,832 | $50,680 | $10,550 | $40,130 |
| 2014 | $2,740 | $50,680 | $10,550 | $40,130 |
Source: Public Records
Map
Nearby Homes
- 2685 Oak Trace
- 2884 Locke Dr
- 1853 Montgomery Ave
- 442 Orville St
- 1837 Burrowes Blvd
- 2018 Rockdell Dr
- 1807 Montgomery Ave
- 2415 New Germany Trebein Rd
- 3031 Willowbrook Way Unit 3031
- 2735 Golden Leaf Dr Unit 18-202
- 2727 Golden Leaf Dr Unit 18-300
- 2695 Bent Creek Ct
- 122 Wilson Ave
- 1607 Montgomery Ave
- 2773 Mulligan Way Unit 291
- 167 W Goodman Dr
- 3043 Cumberland Ln
- 3043 Cumberland Ln Unit 104
- 2504 Bent Grass Dr
- 3129 Crestmont Ln Unit 104
- 515 Thompson Dr
- 2289 Faircreek Ridge Dr
- 2293 Faircreek Ridge Dr
- 2299 Faircreek Ridge Dr
- 508 Thompson Dr
- 3160 Hickorynut Dr
- 2986 Old Yellow Springs Rd
- 3011 Old Yellow Springs Rd
- 2290 Faircreek Ridge Dr
- 2292 Faircreek Ridge Dr
- 499 Thompson Dr
- 2976 Old Yellow Springs Rd
- 2294 Faircreek Ridge Dr
- 2296 Faircreek Ridge Dr
- 2305 Faircreek Ridge Dr
- 3170 Hickorynut Dr
- 495 Thompson Dr
- 3136 Axe Dr
- 2304 Faircreek Ridge Dr
- 3163 Hickorynut Dr
Your Personal Tour Guide
Ask me questions while you tour the home.