Estimated Value: $201,000 - $274,000
4
Beds
3
Baths
2,144
Sq Ft
$117/Sq Ft
Est. Value
About This Home
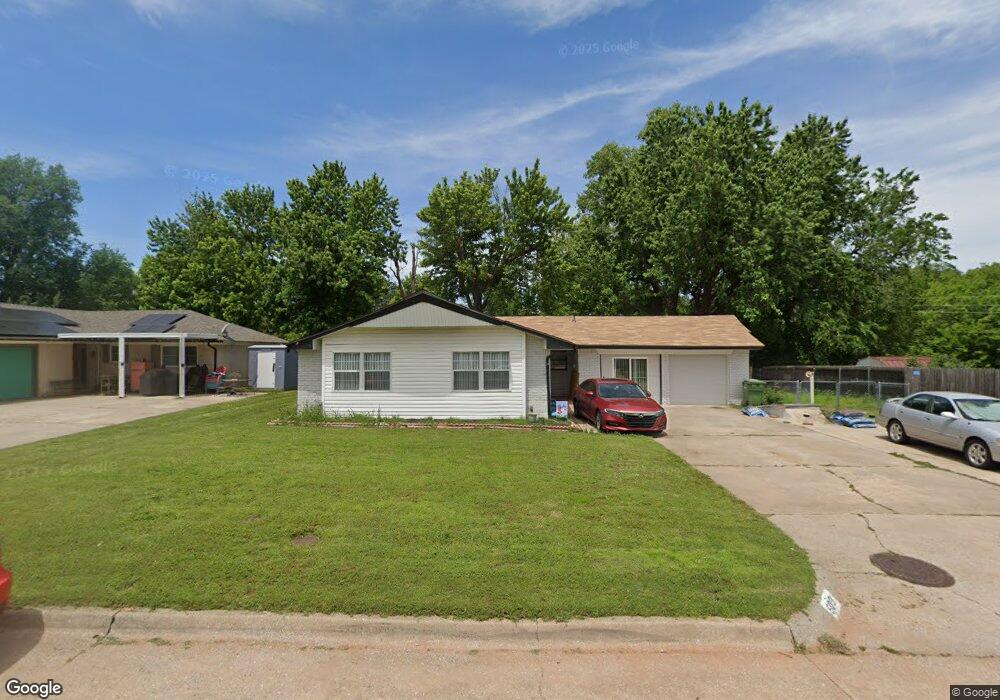
This home is located at 509 Turtle Creek Dr, Yukon, OK 73099 and is currently estimated at $250,561, approximately $116 per square foot. 509 Turtle Creek Dr is a home located in Canadian County with nearby schools including Central Elementary School, Independence Elementary School, and Yukon Middle School.
Ownership History
Date
Name
Owned For
Owner Type
Purchase Details
Closed on
Mar 7, 2025
Sold by
Barrios Frank A Minera and Minera Frank
Bought by
Apc Homes Ii Llc
Current Estimated Value
Home Financials for this Owner
Home Financials are based on the most recent Mortgage that was taken out on this home.
Original Mortgage
$220,000
Outstanding Balance
$201,274
Interest Rate
6.96%
Mortgage Type
New Conventional
Estimated Equity
$49,287
Purchase Details
Closed on
Apr 10, 2023
Sold by
Pando Investments Llc
Bought by
Minera Frank
Purchase Details
Closed on
Feb 13, 2014
Sold by
West Wanda L
Bought by
Soupene Dana
Purchase Details
Closed on
Nov 4, 2002
Sold by
Earnheart Paul Wayne
Bought by
Earnheart Dana L
Purchase Details
Closed on
Sep 6, 1989
Purchase Details
Closed on
Sep 5, 1989
Purchase Details
Closed on
Jun 27, 1989
Purchase Details
Closed on
Jun 1, 1987
Create a Home Valuation Report for This Property
The Home Valuation Report is an in-depth analysis detailing your home's value as well as a comparison with similar homes in the area
Home Values in the Area
Average Home Value in this Area
Purchase History
| Date | Buyer | Sale Price | Title Company |
|---|---|---|---|
| Apc Homes Ii Llc | $275,000 | Chicago Title | |
| Apc Homes Ii Llc | $275,000 | Chicago Title | |
| Minera Frank | $135,000 | Old Republic Title | |
| Pando Investments Llc | $110,000 | Old Republic Title | |
| Soupene Dana | -- | None Available | |
| Earnheart Dana L | -- | -- | |
| -- | -- | -- | |
| -- | $48,500 | -- | |
| -- | -- | -- | |
| -- | -- | -- |
Source: Public Records
Mortgage History
| Date | Status | Borrower | Loan Amount |
|---|---|---|---|
| Open | Apc Homes Ii Llc | $220,000 | |
| Closed | Apc Homes Ii Llc | $220,000 |
Source: Public Records
Tax History Compared to Growth
Tax History
| Year | Tax Paid | Tax Assessment Tax Assessment Total Assessment is a certain percentage of the fair market value that is determined by local assessors to be the total taxable value of land and additions on the property. | Land | Improvement |
|---|---|---|---|---|
| 2024 | $1,197 | $25,343 | $2,040 | $23,303 |
| 2023 | $1,197 | $11,046 | $1,875 | $9,171 |
| 2022 | $1,145 | $10,520 | $1,866 | $8,654 |
| 2021 | $1,094 | $10,019 | $1,848 | $8,171 |
| 2020 | $1,029 | $9,542 | $1,810 | $7,732 |
| 2019 | $983 | $9,088 | $1,774 | $7,314 |
| 2018 | $939 | $8,655 | $1,739 | $6,916 |
| 2017 | $895 | $8,243 | $1,699 | $6,544 |
| 2016 | $853 | $8,243 | $1,704 | $6,539 |
| 2015 | -- | $7,477 | $1,620 | $5,857 |
| 2014 | -- | $7,121 | $1,575 | $5,546 |
Source: Public Records
Map
Nearby Homes
- 3608 Northover Ridge Dr
- 3509 Sawtooth Ridge Dr
- 502 Walnut Ave
- 11020 SW 34th Terrace
- 10401 NW 33rd St
- 12033 SW 31st St
- 621 Yukon Ave
- 616 Kingston Dr
- 601 S 8th St
- 11817 Corie Nicole Ln
- 4601 Grassland Dr
- 600 S 8th St
- 705 Yukon Ave
- 11325 SW 34th Terrace
- 1005 S 3rd St
- 11200 SW 32nd St
- 1100 S 1st St
- 740 Kingston Dr
- 744 Kingston Dr
- 2117 Aminas Way
- 511 Turtle Creek Dr
- 507 Turtle Creek Dr
- 505 Turtle Creek Dr
- 506 Turtle Creek Dr
- 411 Walnut Ave
- 513 Turtle Creek Dr
- 409 Walnut Ave
- 3612 Northover Ridge Dr
- 3600 Moraine Dr
- 3605 Moraine Dr
- 3601 Moraine Dr
- 3613 Moraine Dr
- 3604 Moraine Dr
- 3612 Moraine Dr
- 3601 Northover Ridge Dr
- 11100 SW 34th Terrace
- 3617 Moraine Dr
- 3512 Sawtooth Ridge Dr
- 3620 Moraine Dr
- 3616 Northover Ridge Dr