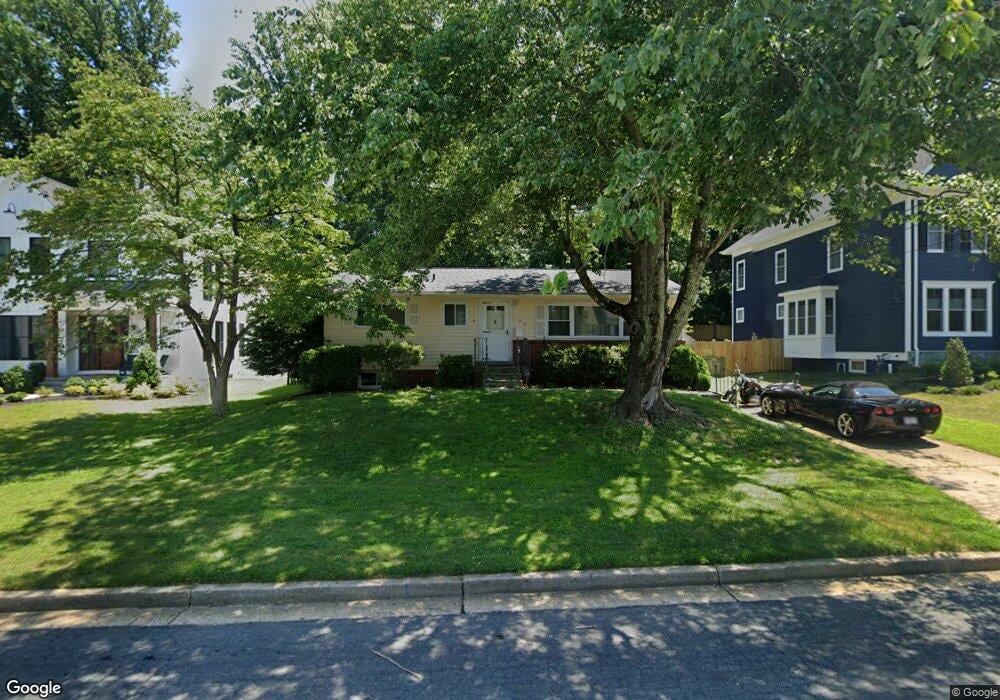
509 Valley Dr SE Vienna, VA 22180
Estimated Value: $1,886,000 - $2,576,000
5
Beds
6
Baths
3,782
Sq Ft
$591/Sq Ft
Est. Value
About This Home
This home is located at 509 Valley Dr SE, Vienna, VA 22180 and is currently estimated at $2,235,857, approximately $591 per square foot. 509 Valley Dr SE is a home located in Fairfax County with nearby schools including Vienna Elementary School, Thoreau Middle School, and Madison High.
Ownership History
Date
Name
Owned For
Owner Type
Purchase Details
Closed on
Jun 17, 2022
Sold by
Conner David W
Bought by
Nessibu Ermias and Abebe Hanna
Current Estimated Value
Home Financials for this Owner
Home Financials are based on the most recent Mortgage that was taken out on this home.
Original Mortgage
$845,500
Outstanding Balance
$797,299
Interest Rate
4.63%
Mortgage Type
New Conventional
Estimated Equity
$1,438,558
Purchase Details
Closed on
Mar 9, 2015
Sold by
Donner Davd W
Bought by
Conner David W
Home Financials for this Owner
Home Financials are based on the most recent Mortgage that was taken out on this home.
Original Mortgage
$370,500
Interest Rate
3.75%
Mortgage Type
New Conventional
Purchase Details
Closed on
Oct 14, 1999
Sold by
Est Anne M Sedlock
Bought by
Connor David W
Home Financials for this Owner
Home Financials are based on the most recent Mortgage that was taken out on this home.
Original Mortgage
$189,635
Interest Rate
7.8%
Create a Home Valuation Report for This Property
The Home Valuation Report is an in-depth analysis detailing your home's value as well as a comparison with similar homes in the area
Home Values in the Area
Average Home Value in this Area
Purchase History
| Date | Buyer | Sale Price | Title Company |
|---|---|---|---|
| Nessibu Ermias | $890,000 | First American Title | |
| Conner David W | -- | -- | |
| Conner David W | -- | -- | |
| Connor David W | $195,500 | -- |
Source: Public Records
Mortgage History
| Date | Status | Borrower | Loan Amount |
|---|---|---|---|
| Open | Nessibu Ermias | $845,500 | |
| Previous Owner | Conner David W | $370,500 | |
| Previous Owner | Connor David W | $189,635 |
Source: Public Records
Tax History
| Year | Tax Paid | Tax Assessment Tax Assessment Total Assessment is a certain percentage of the fair market value that is determined by local assessors to be the total taxable value of land and additions on the property. | Land | Improvement |
|---|---|---|---|---|
| 2025 | $7,553 | $2,164,250 | $400,000 | $1,764,250 |
| 2024 | $9,667 | $834,450 | $380,000 | $454,450 |
| 2023 | $9,247 | $819,450 | $365,000 | $454,450 |
| 2022 | $8,033 | $702,500 | $330,000 | $372,500 |
| 2021 | $7,835 | $667,650 | $315,000 | $352,650 |
| 2020 | $7,590 | $641,360 | $315,000 | $326,360 |
| 2019 | $7,459 | $630,210 | $315,000 | $315,210 |
| 2018 | $6,764 | $588,160 | $315,000 | $273,160 |
| 2017 | $6,678 | $575,200 | $310,000 | $265,200 |
| 2016 | $6,851 | $591,380 | $310,000 | $281,380 |
Source: Public Records
Map
Nearby Homes
- 206 Park Terrace Ct SE Unit 38
- 214 Park Terrace Ct SE Unit 88
- 408 Fellini Ct SE
- 715 Park St SE
- 511 Orrin St SE
- 324 Tapawingo Rd SE
- 623 Echols St SE
- 107 Moore Ave SE
- 103 Battle St SW
- 104 Dogwood St SW
- 102 Moore Ave SW
- 112 Elm St SW
- 100 Tapawingo Rd SE
- 129 Park St NE
- 151 Center St S Unit 1
- 903 Lauren Ln SE
- 118 Oak St SW
- 703 Cottage St SW
- 961 Nicholas Cir SE
- 104 Mashie Ct SE
- 507 Valley Dr SE
- 511 Valley Dr SE
- 505 Valley Dr SE
- 513 Valley Dr SE
- 515 Valley Dr SE
- 508 Valley Dr SE
- 503 Valley Dr SE
- 510 Valley Dr SE
- 506 Valley Dr SE
- 500 Glyndon St SE
- 512 Valley Dr SE
- 514 Valley Dr SE
- 608 Ninovan Rd SE
- 517 Valley Dr SE
- 501 Valley Dr SE
- 504 Valley Dr SE
- 309 Branch Cir SE
- 612 Ninovan Rd SE
- 502 Glyndon St SE
- 311 Branch Cir SE
Your Personal Tour Guide
Ask me questions while you tour the home.