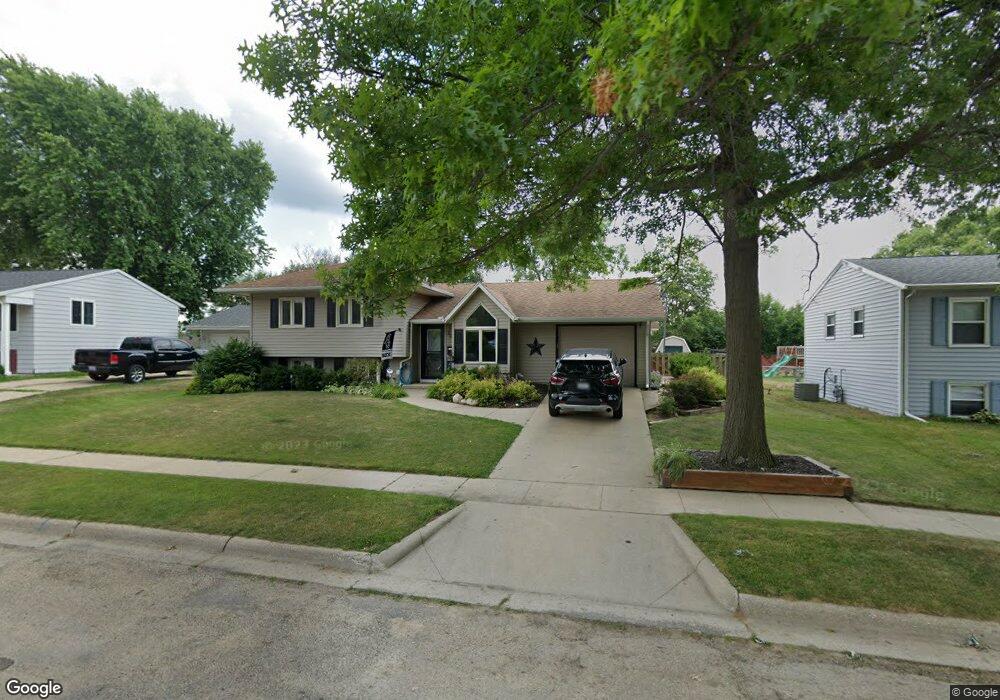
509 W 14th St Rock Falls, IL 61071
Estimated Value: $136,000 - $188,396
4
Beds
2
Baths
1,372
Sq Ft
$123/Sq Ft
Est. Value
About This Home
This home is located at 509 W 14th St, Rock Falls, IL 61071 and is currently estimated at $168,849, approximately $123 per square foot. 509 W 14th St is a home located in Whiteside County with nearby schools including Merrill Elementary School, Dillon Elementary School, and Rock Falls Middle School.
Ownership History
Date
Name
Owned For
Owner Type
Purchase Details
Closed on
Jun 8, 2020
Sold by
Leseman Bailey R
Bought by
Bohm Zachary J
Current Estimated Value
Purchase Details
Closed on
Mar 6, 2015
Sold by
Stanley Matthew E and Stanley Susan M
Bought by
Brien James P O
Home Financials for this Owner
Home Financials are based on the most recent Mortgage that was taken out on this home.
Original Mortgage
$114,000
Interest Rate
3%
Mortgage Type
New Conventional
Purchase Details
Closed on
Sep 4, 2007
Sold by
Leuschke Bradley K and Leuschke Andrea L
Bought by
Stanley Matthew E and Stanley Susan M
Home Financials for this Owner
Home Financials are based on the most recent Mortgage that was taken out on this home.
Original Mortgage
$145,000
Interest Rate
6.72%
Mortgage Type
New Conventional
Create a Home Valuation Report for This Property
The Home Valuation Report is an in-depth analysis detailing your home's value as well as a comparison with similar homes in the area
Home Values in the Area
Average Home Value in this Area
Purchase History
| Date | Buyer | Sale Price | Title Company |
|---|---|---|---|
| Bohm Zachary J | -- | None Available | |
| Brien James P O | $120,000 | None Available | |
| Stanley Matthew E | $145,000 | None Available |
Source: Public Records
Mortgage History
| Date | Status | Borrower | Loan Amount |
|---|---|---|---|
| Previous Owner | Brien James P O | $114,000 | |
| Previous Owner | Stanley Matthew E | $145,000 |
Source: Public Records
Tax History Compared to Growth
Tax History
| Year | Tax Paid | Tax Assessment Tax Assessment Total Assessment is a certain percentage of the fair market value that is determined by local assessors to be the total taxable value of land and additions on the property. | Land | Improvement |
|---|---|---|---|---|
| 2024 | $4,984 | $51,434 | $5,222 | $46,212 |
| 2023 | $4,648 | $47,435 | $4,816 | $42,619 |
| 2022 | $4,420 | $44,225 | $4,541 | $39,684 |
| 2021 | $4,213 | $41,840 | $4,296 | $37,544 |
| 2020 | $4,205 | $41,125 | $4,223 | $36,902 |
| 2019 | $3,957 | $39,654 | $4,072 | $35,582 |
| 2018 | $3,687 | $38,770 | $3,981 | $34,789 |
| 2017 | $3,672 | $38,043 | $3,906 | $34,137 |
| 2016 | $3,592 | $37,403 | $3,840 | $33,563 |
| 2015 | $358 | $39,289 | $4,034 | $35,255 |
| 2014 | $355 | $38,240 | $3,926 | $34,314 |
| 2013 | $358 | $39,289 | $4,034 | $35,255 |
Source: Public Records
Map
Nearby Homes