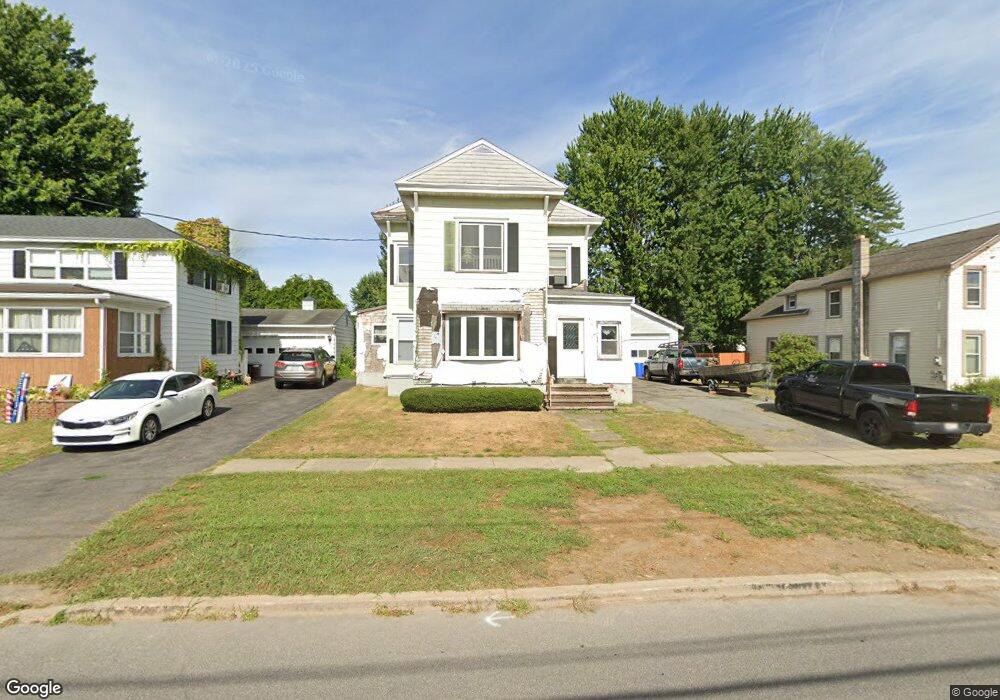
509 W 3rd St S Fulton, NY 13069
Estimated Value: $64,000 - $156,000
4
Beds
2
Baths
1,744
Sq Ft
$71/Sq Ft
Est. Value
About This Home
This home is located at 509 W 3rd St S, Fulton, NY 13069 and is currently estimated at $123,634, approximately $70 per square foot. 509 W 3rd St S is a home located in Oswego County with nearby schools including G Ray Bodley High School.
Ownership History
Date
Name
Owned For
Owner Type
Purchase Details
Closed on
Jan 31, 2005
Sold by
Sec Housing & Urban Dev
Bought by
Metcalf Danny
Current Estimated Value
Home Financials for this Owner
Home Financials are based on the most recent Mortgage that was taken out on this home.
Original Mortgage
$32,000
Outstanding Balance
$16,179
Interest Rate
5.67%
Mortgage Type
New Conventional
Estimated Equity
$107,455
Purchase Details
Closed on
Jan 21, 2005
Sold by
Secretary Of Housing & Urban Development
Bought by
Metcalf Danny
Home Financials for this Owner
Home Financials are based on the most recent Mortgage that was taken out on this home.
Original Mortgage
$32,000
Outstanding Balance
$16,179
Interest Rate
5.67%
Mortgage Type
New Conventional
Estimated Equity
$107,455
Purchase Details
Closed on
May 21, 2001
Sold by
Miner Donald H
Bought by
Cummins James I
Purchase Details
Closed on
Jul 11, 2000
Sold by
Palmer Verna
Bought by
Keffer Christine T
Create a Home Valuation Report for This Property
The Home Valuation Report is an in-depth analysis detailing your home's value as well as a comparison with similar homes in the area
Home Values in the Area
Average Home Value in this Area
Purchase History
| Date | Buyer | Sale Price | Title Company |
|---|---|---|---|
| Metcalf Danny | $30,000 | Salvatore F. Lanza | |
| Metcalf Danny | $30,000 | None Available | |
| Cummins James I | $48,500 | Robert Fix | |
| Keffer Christine T | -- | Fred I. Sumner |
Source: Public Records
Mortgage History
| Date | Status | Borrower | Loan Amount |
|---|---|---|---|
| Open | Metcalf Danny | $32,000 | |
| Closed | Metcalf Danny | $32,000 |
Source: Public Records
Tax History Compared to Growth
Tax History
| Year | Tax Paid | Tax Assessment Tax Assessment Total Assessment is a certain percentage of the fair market value that is determined by local assessors to be the total taxable value of land and additions on the property. | Land | Improvement |
|---|---|---|---|---|
| 2024 | $5,258 | $75,600 | $6,300 | $69,300 |
| 2023 | $3,675 | $75,600 | $6,300 | $69,300 |
| 2022 | $3,551 | $75,600 | $6,300 | $69,300 |
| 2021 | $3,610 | $60,000 | $10,600 | $49,400 |
| 2020 | $2,760 | $60,000 | $10,600 | $49,400 |
| 2019 | $2,699 | $60,000 | $10,600 | $49,400 |
| 2018 | $2,699 | $60,000 | $10,600 | $49,400 |
| 2017 | $2,687 | $60,000 | $10,600 | $49,400 |
| 2016 | $2,713 | $60,000 | $10,600 | $49,400 |
| 2015 | -- | $60,000 | $10,600 | $49,400 |
| 2014 | -- | $60,000 | $10,600 | $49,400 |
Source: Public Records
Map
Nearby Homes