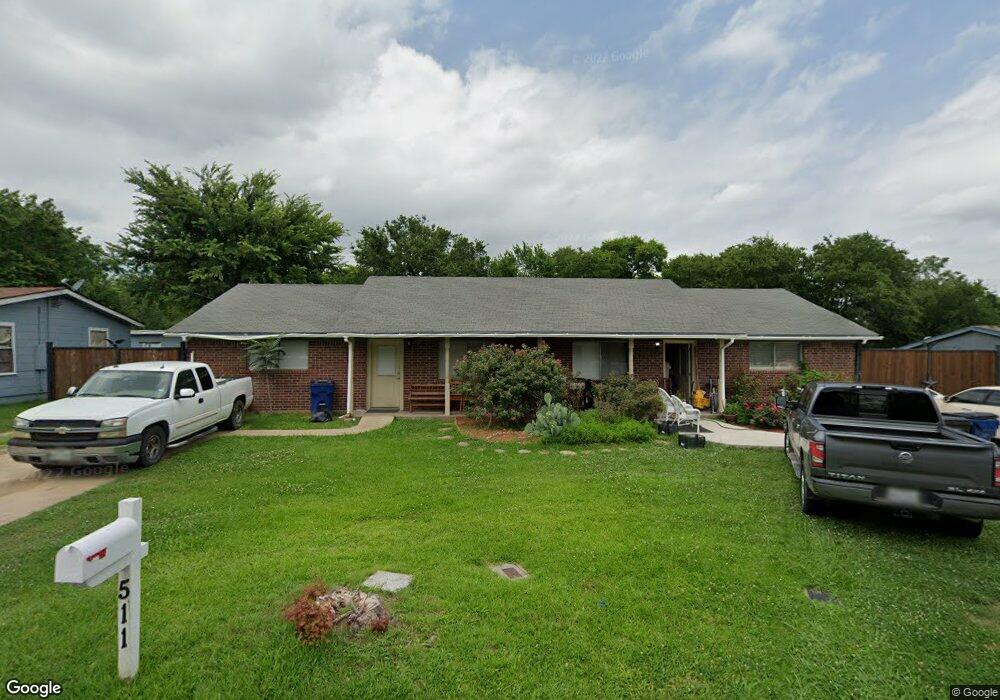
509 W Collins St Unit 511 Denison, TX 75020
Estimated Value: $221,779 - $244,000
--
Bed
--
Bath
1,932
Sq Ft
$121/Sq Ft
Est. Value
About This Home
This home is located at 509 W Collins St Unit 511, Denison, TX 75020 and is currently estimated at $232,890, approximately $120 per square foot. 509 W Collins St Unit 511 is a home located in Grayson County with nearby schools including Scott Middle School, Denison High School, and St. Luke's Parish Day School.
Ownership History
Date
Name
Owned For
Owner Type
Purchase Details
Closed on
May 28, 2010
Sold by
Keaton James and Keaton Debbie
Bought by
Pimentel Camerina
Current Estimated Value
Home Financials for this Owner
Home Financials are based on the most recent Mortgage that was taken out on this home.
Original Mortgage
$38,000
Interest Rate
5%
Mortgage Type
Seller Take Back
Purchase Details
Closed on
Aug 10, 2009
Sold by
Williams James
Bought by
Pimentel Camerina
Home Financials for this Owner
Home Financials are based on the most recent Mortgage that was taken out on this home.
Original Mortgage
$1,000
Interest Rate
5.44%
Mortgage Type
Seller Take Back
Purchase Details
Closed on
Jun 30, 2004
Sold by
Saulsberry Chris W and Saulsberry Joyce A
Bought by
Pimentel Camerina
Home Financials for this Owner
Home Financials are based on the most recent Mortgage that was taken out on this home.
Original Mortgage
$78,250
Interest Rate
6.3%
Mortgage Type
Purchase Money Mortgage
Create a Home Valuation Report for This Property
The Home Valuation Report is an in-depth analysis detailing your home's value as well as a comparison with similar homes in the area
Home Values in the Area
Average Home Value in this Area
Purchase History
| Date | Buyer | Sale Price | Title Company |
|---|---|---|---|
| Pimentel Camerina | -- | Red River Title Co | |
| Pimentel Camerina | $5,000 | None Available | |
| Pimentel Camerina | -- | -- |
Source: Public Records
Mortgage History
| Date | Status | Borrower | Loan Amount |
|---|---|---|---|
| Closed | Pimentel Camerina | $38,000 | |
| Previous Owner | Pimentel Camerina | $1,000 | |
| Previous Owner | Pimentel Camerina | $78,250 |
Source: Public Records
Tax History Compared to Growth
Tax History
| Year | Tax Paid | Tax Assessment Tax Assessment Total Assessment is a certain percentage of the fair market value that is determined by local assessors to be the total taxable value of land and additions on the property. | Land | Improvement |
|---|---|---|---|---|
| 2025 | $3,544 | $219,139 | $57,200 | $161,939 |
| 2024 | $4,870 | $209,635 | $54,600 | $155,035 |
| 2023 | $4,558 | $215,526 | $53,170 | $162,356 |
| 2022 | $5,104 | $214,802 | $53,170 | $161,632 |
| 2021 | $3,666 | $145,337 | $23,660 | $121,677 |
| 2020 | $3,644 | $141,054 | $19,500 | $121,554 |
| 2019 | $3,575 | $138,925 | $19,500 | $119,425 |
| 2018 | $3,255 | $117,341 | $10,400 | $106,941 |
| 2017 | $2,779 | $99,329 | $5,720 | $93,609 |
| 2016 | $2,268 | $81,061 | $5,720 | $75,341 |
| 2015 | $2,446 | $86,587 | $5,720 | $80,867 |
| 2014 | -- | $86,702 | $5,720 | $80,982 |
Source: Public Records
Map
Nearby Homes
- 430 W Coffin St
- 614 W Collins St
- 614 Rice St
- 607 W Baker St
- 616 & 618 Rice St
- 611 W Baker St
- 513 W Coffin St
- 509 W Coffin St
- 608 W Baker St
- 516 W Florence St
- 508 W Florence St
- 601 Dubois St
- 701 W Star St
- 505 W Ford St
- 1927 S Fannin Ave
- 2000 S Fannin Ave
- 711 Dubois St
- 700 Dubois St
- 603 W Star St
- 916 W Collins St
- 517 W Collins St
- 501 W Collins St
- 519 W Collins St
- 504 Rice St
- 510 W Collins St
- 514 W Collins St
- 516 W Collins St
- 520 Rice St
- 502 Rice St
- 500 W Collins St
- 531 W Collins St
- 522 Rice St
- 2512 S Fannin Ave
- 2620 S Fannin Ave
- 2622 S Fannin Ave
- 2624 S Fannin Ave
- 524 Rice St
- 522 W Collins St
- 2608 S Fannin Ave Unit 2610
- 2608 S Fannin Ave