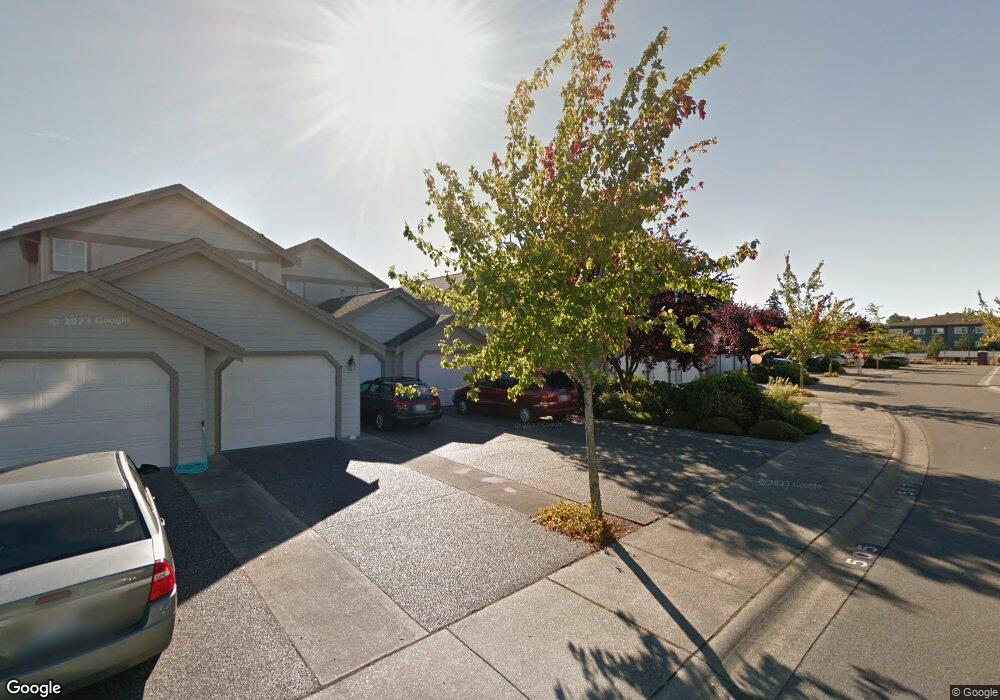
509 W Kellogg Rd Unit 509 Bellingham, WA 98226
Cordata NeighborhoodEstimated Value: $422,000 - $505,000
2
Beds
2
Baths
1,230
Sq Ft
$365/Sq Ft
Est. Value
About This Home
This home is located at 509 W Kellogg Rd Unit 509, Bellingham, WA 98226 and is currently estimated at $449,270, approximately $365 per square foot. 509 W Kellogg Rd Unit 509 is a home located in Whatcom County with nearby schools including Cordata Elementary School, Shuksan Middle School, and Squalicum High School.
Ownership History
Date
Name
Owned For
Owner Type
Purchase Details
Closed on
Dec 3, 2024
Sold by
Peregrine Property Holdings Llc
Bought by
Autoguide Llc
Current Estimated Value
Purchase Details
Closed on
Mar 29, 2021
Sold by
Reid Kristen C and Anderson Roxanne Lee
Bought by
Peregrine Property Holdings Llc
Purchase Details
Closed on
Feb 23, 2021
Sold by
Anderson Roxanne Lee
Bought by
Strandberg Dixie
Purchase Details
Closed on
Jan 5, 2018
Sold by
Whatcom County
Bought by
Reid Kristen C and Unit Owners Association Of The Heights At Cor
Purchase Details
Closed on
Aug 14, 2008
Sold by
Duncan Robert S
Bought by
Strandberg Dixie Lee
Home Financials for this Owner
Home Financials are based on the most recent Mortgage that was taken out on this home.
Original Mortgage
$32,004
Interest Rate
6.32%
Mortgage Type
Stand Alone Second
Create a Home Valuation Report for This Property
The Home Valuation Report is an in-depth analysis detailing your home's value as well as a comparison with similar homes in the area
Home Values in the Area
Average Home Value in this Area
Purchase History
| Date | Buyer | Sale Price | Title Company |
|---|---|---|---|
| Autoguide Llc | $313 | None Listed On Document | |
| Autoguide Llc | $313 | None Listed On Document | |
| Autoguide Llc | $313 | None Listed On Document | |
| Peregrine Property Holdings Llc | $200,000 | None Available | |
| Strandberg Dixie | -- | -- | |
| Reid Kristen C | $200,000 | None Listed On Document | |
| Strandberg Dixie Lee | $210,280 | Stewart Title Company |
Source: Public Records
Mortgage History
| Date | Status | Borrower | Loan Amount |
|---|---|---|---|
| Previous Owner | Strandberg Dixie Lee | $32,004 | |
| Previous Owner | Strandberg Dixie Lee | $180,000 |
Source: Public Records
Tax History Compared to Growth
Tax History
| Year | Tax Paid | Tax Assessment Tax Assessment Total Assessment is a certain percentage of the fair market value that is determined by local assessors to be the total taxable value of land and additions on the property. | Land | Improvement |
|---|---|---|---|---|
| 2024 | $3,211 | $412,321 | $61,439 | $350,882 |
| 2023 | $3,211 | $412,321 | $61,439 | $350,882 |
| 2022 | $2,805 | $371,460 | $55,350 | $316,110 |
| 2021 | $2,530 | $302,000 | $45,000 | $257,000 |
| 2020 | $2,413 | $257,095 | $41,138 | $215,957 |
| 2019 | $2,111 | $236,956 | $37,916 | $199,040 |
| 2018 | $327 | $207,834 | $33,256 | $174,578 |
| 2017 | $346 | $178,866 | $28,621 | $150,245 |
| 2016 | $344 | $163,539 | $26,168 | $137,371 |
| 2015 | $1,491 | $132,125 | $21,140 | $110,985 |
| 2014 | -- | $132,125 | $21,140 | $110,985 |
| 2013 | -- | $122,750 | $19,640 | $103,110 |
Source: Public Records
Map
Nearby Homes
- 4121 Village Dr Unit 9
- 504 Darby Dr Unit 110
- 1150 E Village Ln Unit A
- 516 Darby Dr Unit 207
- 516 Darby Dr Unit 213
- 516 Darby Dr Unit 104
- 500 Darby Dr Unit 304
- 500 Darby Dr Unit 210
- 500 Darby Dr Unit 314
- 512 Darby Dr Unit 213
- 512 Darby Dr Unit 111
- 512 Darby Dr Unit 212
- 617 Sunflower Ln Unit E2
- 4314 Gale Ln
- 5090 Festival Blvd Unit 1C
- 4305 Sumac Ln
- 4015 Eliza Ave Unit 120
- 4015 Eliza Ave Unit 31
- 5070 Festival Blvd Unit 2B
- 5064 Festival Blvd Unit 2B
- 517 W Kellogg Rd Unit 517
- 511 W Kellogg Rd Unit 511
- 553 W Kellogg Rd
- 555 W Kellogg Rd Unit 555
- 557 W Kellogg Rd
- 551 W Kellogg Rd Unit 551
- 559 W Kellogg Rd
- 561 W Kellogg Rd Unit 561
- 541 W Kellogg Rd Unit 541
- 539 W Kellogg Rd
- 537 W Kellogg Rd Unit 537
- 535 W Kellogg Rd Unit 535
- 525 W Kellogg Rd Unit 525
- 523 W Kellogg Rd Unit 523
- 521 W Kellogg Rd Unit 521
- 519 W Kellogg Rd Unit 519
- 563 W Kellogg Rd
- 565 W Kellogg Rd Unit 565
- 567 W Kellogg Rd
- 569 W Kellogg Rd Unit 569