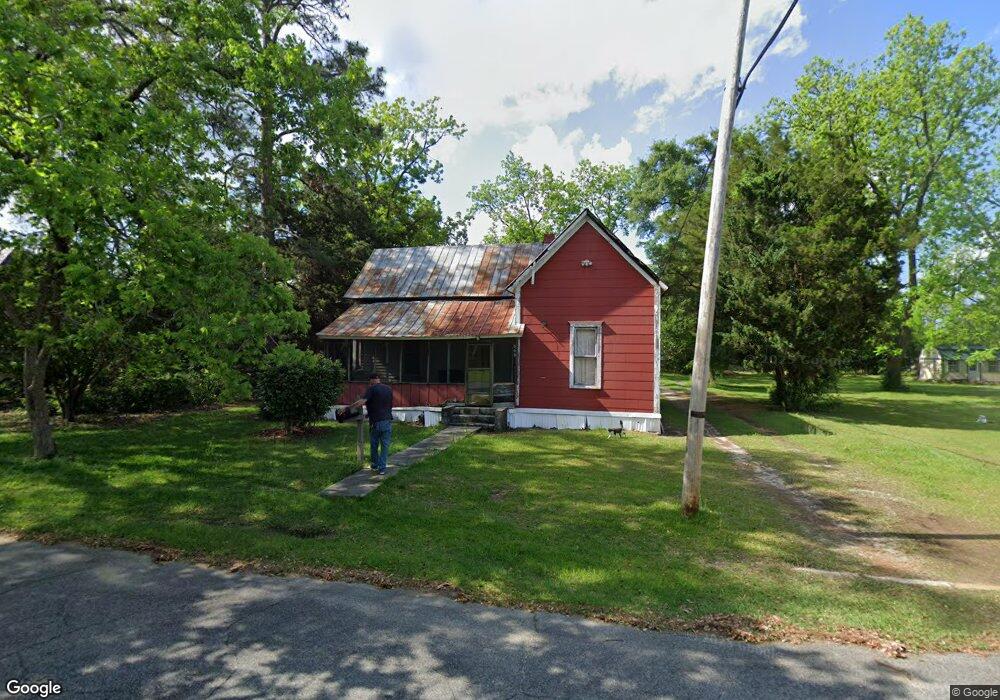
509 W Suwanee St Fitzgerald, GA 31750
Estimated Value: $71,000 - $124,000
2
Beds
1
Bath
1,192
Sq Ft
$72/Sq Ft
Est. Value
About This Home
This home is located at 509 W Suwanee St, Fitzgerald, GA 31750 and is currently estimated at $85,990, approximately $72 per square foot. 509 W Suwanee St is a home located in Ben Hill County with nearby schools including Ben Hill County Primary School, Ben Hill Elementary School, and Ben Hill County Middle School.
Ownership History
Date
Name
Owned For
Owner Type
Purchase Details
Closed on
Jul 30, 2003
Sold by
Community National Bank
Bought by
Ethridge John R and Ethridge Anna S
Current Estimated Value
Purchase Details
Closed on
Apr 2, 2002
Sold by
Whipple Willie James
Bought by
Community National Bank
Purchase Details
Closed on
Aug 24, 2001
Sold by
Community National Bank
Bought by
Whipple Willie James
Purchase Details
Closed on
Aug 8, 2001
Sold by
Johnson Donnie
Bought by
Community National Bank
Purchase Details
Closed on
May 29, 1998
Sold by
Johnson Donniee
Bought by
Johnson Donnie
Purchase Details
Closed on
Jan 6, 1997
Sold by
Milligan Jack E
Bought by
Johnson Donniee
Purchase Details
Closed on
Feb 1, 1996
Sold by
Barnes Jayson W
Bought by
Milligan Jack E
Purchase Details
Closed on
Nov 2, 1994
Sold by
Barnes Marie
Bought by
Barnes Jayson W
Purchase Details
Closed on
Feb 26, 1993
Bought by
Barnes Marie
Create a Home Valuation Report for This Property
The Home Valuation Report is an in-depth analysis detailing your home's value as well as a comparison with similar homes in the area
Home Values in the Area
Average Home Value in this Area
Purchase History
| Date | Buyer | Sale Price | Title Company |
|---|---|---|---|
| Ethridge John R | $13,500 | -- | |
| Community National Bank | -- | -- | |
| Whipple Willie James | $27,700 | -- | |
| Community National Bank | $27,700 | -- | |
| Johnson Donnie | -- | -- | |
| Johnson Donniee | $25,000 | -- | |
| Milligan Jack E | $13,000 | -- | |
| Barnes Jayson W | -- | -- | |
| Barnes Marie | $15,000 | -- |
Source: Public Records
Tax History Compared to Growth
Tax History
| Year | Tax Paid | Tax Assessment Tax Assessment Total Assessment is a certain percentage of the fair market value that is determined by local assessors to be the total taxable value of land and additions on the property. | Land | Improvement |
|---|---|---|---|---|
| 2024 | $266 | $6,231 | $2,949 | $3,282 |
| 2023 | $165 | $5,379 | $2,208 | $3,171 |
| 2022 | $181 | $5,478 | $2,208 | $3,270 |
| 2021 | $192 | $5,576 | $2,457 | $3,119 |
| 2020 | $193 | $5,543 | $2,458 | $3,085 |
| 2019 | $222 | $6,424 | $2,458 | $3,966 |
| 2018 | $276 | $6,413 | $2,458 | $3,955 |
| 2017 | $229 | $6,576 | $2,458 | $4,118 |
| 2016 | -- | $6,575 | $2,458 | $4,118 |
| 2015 | -- | $7,347 | $2,458 | $4,889 |
| 2014 | -- | $7,449 | $2,458 | $4,991 |
Source: Public Records
Map
Nearby Homes
- 502 W Alapaha St
- 606 W Suwanee St
- 303 W Altamaha St
- 608 W Sultana Dr
- 807 W Oconee St
- 616 N Main St
- 613 W Central Ave
- 906 N Merrimac Dr
- 503 N Main St
- 710 W Central Ave
- 615 W Pine St
- 816 W Central Ave
- 102 Irwinville Hwy
- 118 Patton Ave
- 124 N Main Street Extension
- 113 S Merrimac Dr
- 124 Patton Ave
- 118 Irwinville Hwy
- 409 W Magnolia St
- 209 E Ohoopee St
- 515 W Suwanee St
- 505 W Suwanee St
- 508 W Alapaha St
- 501 W Suwanee St
- 516 W Suwanee St
- 514 W Alapaha St
- 510 W Alapaha St
- 601 W Suwanee St
- 508 W Suwanee St
- 506 W Suwanee St
- 110 N Longstreet St
- 300 bloc W Suwanee St
- 502 W Suwanee St
- 605 W Suwanee St
- 604 W Alapaha St
- 415 W Suwanee St
- 602 W Suwanee St
- 608 W Alapaha St
- 416 W Alapaha St
- W W Alapaha St