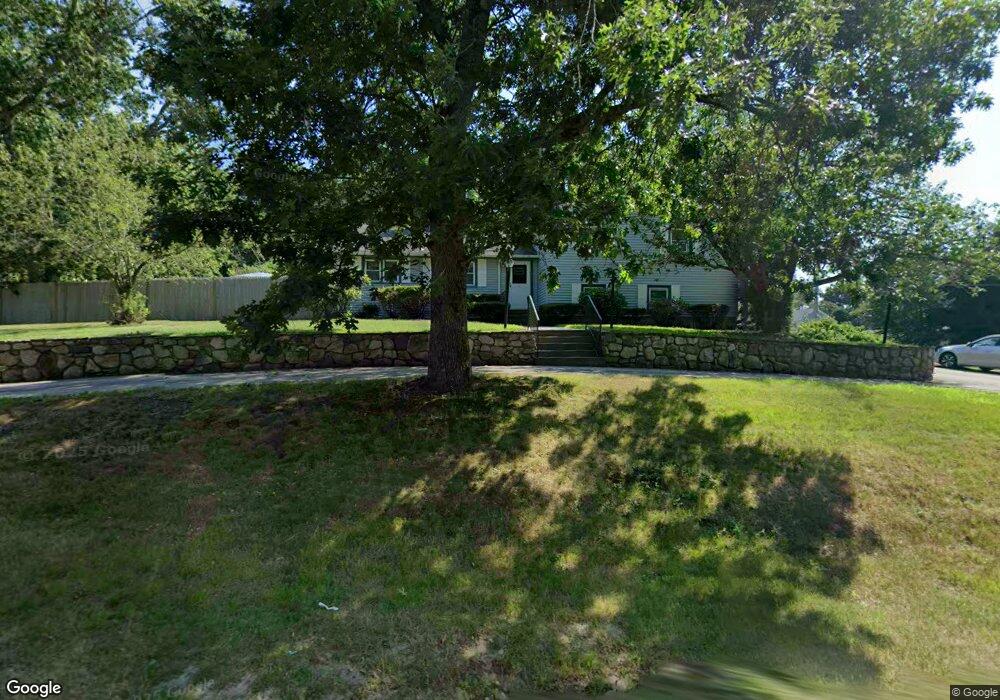
509 Webster St Marshfield, MA 02050
Estimated Value: $729,000 - $891,000
5
Beds
2
Baths
1,566
Sq Ft
$498/Sq Ft
Est. Value
About This Home
This home is located at 509 Webster St, Marshfield, MA 02050 and is currently estimated at $779,768, approximately $497 per square foot. 509 Webster St is a home located in Plymouth County with nearby schools including Governor Edward Winslow School, Furnace Brook Middle School, and Marshfield High School.
Ownership History
Date
Name
Owned For
Owner Type
Purchase Details
Closed on
Jul 15, 1998
Sold by
Sullivan Edwin C and Sullivan Donna M
Bought by
Roche Paul E and Roche Ellen F
Current Estimated Value
Home Financials for this Owner
Home Financials are based on the most recent Mortgage that was taken out on this home.
Original Mortgage
$127,500
Interest Rate
6.98%
Mortgage Type
Purchase Money Mortgage
Purchase Details
Closed on
Feb 5, 1993
Sold by
Desmond Joseph A and Desmond Mary P
Bought by
Sullivan Edwin C and Sullivan Donna M
Create a Home Valuation Report for This Property
The Home Valuation Report is an in-depth analysis detailing your home's value as well as a comparison with similar homes in the area
Home Values in the Area
Average Home Value in this Area
Purchase History
| Date | Buyer | Sale Price | Title Company |
|---|---|---|---|
| Roche Paul E | $207,500 | -- | |
| Roche Paul E | $207,500 | -- | |
| Sullivan Edwin C | $155,000 | -- |
Source: Public Records
Mortgage History
| Date | Status | Borrower | Loan Amount |
|---|---|---|---|
| Open | Sullivan Edwin C | $119,000 | |
| Closed | Sullivan Edwin C | $127,500 | |
| Previous Owner | Sullivan Edwin C | $30,200 |
Source: Public Records
Tax History
| Year | Tax Paid | Tax Assessment Tax Assessment Total Assessment is a certain percentage of the fair market value that is determined by local assessors to be the total taxable value of land and additions on the property. | Land | Improvement |
|---|---|---|---|---|
| 2025 | $7,117 | $718,900 | $308,400 | $410,500 |
| 2024 | $6,826 | $657,000 | $293,700 | $363,300 |
| 2023 | $6,131 | $600,400 | $272,700 | $327,700 |
| 2022 | $6,131 | $473,400 | $220,300 | $253,100 |
| 2021 | $5,958 | $451,700 | $218,200 | $233,500 |
| 2020 | $5,605 | $420,500 | $199,300 | $221,200 |
| 2019 | $5,626 | $420,500 | $199,300 | $221,200 |
| 2018 | $5,622 | $420,500 | $199,300 | $221,200 |
| 2017 | $5,097 | $371,500 | $188,800 | $182,700 |
| 2016 | $4,807 | $346,300 | $178,300 | $168,000 |
| 2015 | $4,602 | $346,300 | $178,300 | $168,000 |
| 2014 | $3,913 | $294,400 | $163,600 | $130,800 |
Source: Public Records
Map
Nearby Homes
- 17 Whitford Dr
- 507 Webster St
- 6 Whitford Dr
- 506 Webster St
- 14 Whitford Dr
- 192 Whitford Cir
- 518 Webster St
- 518 Webster St Unit 1
- 29 Whitford Dr
- 487 Webster St
- 494 Webster St
- 22 Whitford Dr
- 184 Whitford Cir
- 533 Webster St
- 11 Orchard Rd
- 12 Whitford Cir
- 46 Fairways Edge Dr
- 56 Fairways Edge Dr
- 36 Fairways Edge Dr
- 189 Whitford Cir
Your Personal Tour Guide
Ask me questions while you tour the home.