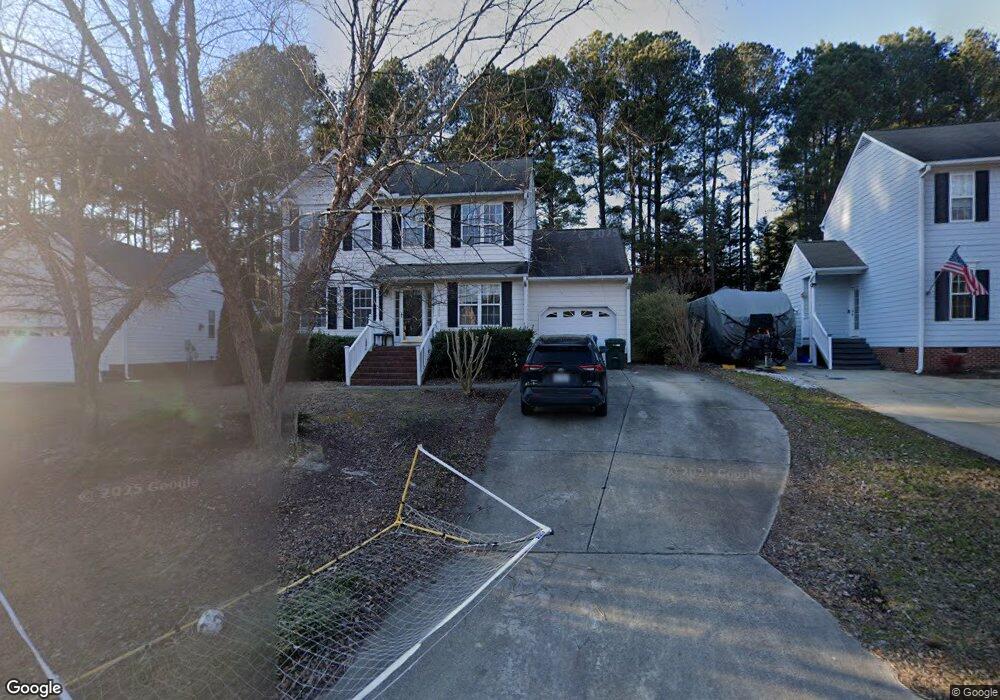
509 Wheeling Cir Durham, NC 27713
South Durham NeighborhoodEstimated Value: $394,303 - $429,000
3
Beds
3
Baths
1,425
Sq Ft
$284/Sq Ft
Est. Value
About This Home
This home is located at 509 Wheeling Cir, Durham, NC 27713 and is currently estimated at $405,326, approximately $284 per square foot. 509 Wheeling Cir is a home located in Durham County with nearby schools including Pearsontown Elementary School, Lowe's Grove Middle, and Hillside High School.
Ownership History
Date
Name
Owned For
Owner Type
Purchase Details
Closed on
Jul 29, 2016
Sold by
Uzzell Kamala
Bought by
Penders Brian and Davis Penders Hallie E
Current Estimated Value
Home Financials for this Owner
Home Financials are based on the most recent Mortgage that was taken out on this home.
Original Mortgage
$208,488
Outstanding Balance
$166,349
Interest Rate
3.48%
Mortgage Type
VA
Estimated Equity
$238,977
Purchase Details
Closed on
Jun 27, 2003
Sold by
Uzzell Kamala L
Bought by
Uzzell Kamala L and Uzzell James P
Home Financials for this Owner
Home Financials are based on the most recent Mortgage that was taken out on this home.
Original Mortgage
$117,500
Interest Rate
3.75%
Mortgage Type
Purchase Money Mortgage
Purchase Details
Closed on
Feb 28, 2001
Sold by
Cynmar Designs Inc
Bought by
Uzzell Kamala L
Home Financials for this Owner
Home Financials are based on the most recent Mortgage that was taken out on this home.
Original Mortgage
$116,800
Interest Rate
7.06%
Create a Home Valuation Report for This Property
The Home Valuation Report is an in-depth analysis detailing your home's value as well as a comparison with similar homes in the area
Home Values in the Area
Average Home Value in this Area
Purchase History
| Date | Buyer | Sale Price | Title Company |
|---|---|---|---|
| Penders Brian | $220,000 | -- | |
| Uzzell Kamala L | -- | -- | |
| Uzzell Kamala L | $146,000 | -- |
Source: Public Records
Mortgage History
| Date | Status | Borrower | Loan Amount |
|---|---|---|---|
| Open | Penders Brian | $208,488 | |
| Previous Owner | Uzzell Kamala L | $117,500 | |
| Previous Owner | Uzzell Kamala L | $116,800 |
Source: Public Records
Tax History
| Year | Tax Paid | Tax Assessment Tax Assessment Total Assessment is a certain percentage of the fair market value that is determined by local assessors to be the total taxable value of land and additions on the property. | Land | Improvement |
|---|---|---|---|---|
| 2025 | $4,036 | $407,156 | $127,000 | $280,156 |
| 2024 | $2,948 | $211,369 | $47,775 | $163,594 |
| 2023 | $2,769 | $211,369 | $47,775 | $163,594 |
| 2022 | $2,705 | $211,369 | $47,775 | $163,594 |
| 2021 | $2,693 | $211,369 | $47,775 | $163,594 |
| 2020 | $2,629 | $211,369 | $47,775 | $163,594 |
| 2019 | $2,629 | $211,369 | $47,775 | $163,594 |
| 2018 | $2,483 | $183,071 | $31,850 | $151,221 |
| 2017 | $2,465 | $183,071 | $31,850 | $151,221 |
| 2016 | $2,382 | $183,071 | $31,850 | $151,221 |
| 2015 | $2,490 | $179,900 | $34,282 | $145,618 |
| 2014 | $2,490 | $179,900 | $34,282 | $145,618 |
Source: Public Records
Map
Nearby Homes
- 63 Lake Village Dr
- 515 Wellingham Dr
- 8 Drummond Ct
- 1058 Flagler St
- 1062 Flagler St
- 3105 Dunnock Dr
- 6527 Rossford Ln
- 6519 Amber Springs Dr
- 620 Wellingham Dr
- 6500 Amber Springs Dr
- 6608 Rossford Ln
- 6004 Tahoe Dr
- 1101 Canary Pepper Dr
- 1001 Pebble Creek Crossing Unit 11
- 1129 Pebble Creek Crossing
- 6502 Barbee Rd
- 1107 Rocketcress Dr
- 1019 Catch Fly Ln
- 1049 Laceflower Dr
- 1038 Laceflower Dr
- 511 Wheeling Cir
- 507 Wheeling Cir
- 505 Wheeling Cir
- 513 Wheeling Cir
- 602 Windcrest Rd
- 516 Windcrest Rd
- 604 Windcrest Rd
- 512 Windcrest Rd
- 503 Wheeling Cir
- 515 Wheeling Cir
- 510 Windcrest Rd
- 608 Windcrest Rd
- 506 Wheeling Cir
- 508 Wheeling Cir
- 700 Windcrest Rd
- 508 Windcrest Rd
- 504 Wheeling Cir
- 510 Wheeling Cir
- 517 Wheeling Cir
- 501 Wheeling Cir
Your Personal Tour Guide
Ask me questions while you tour the home.