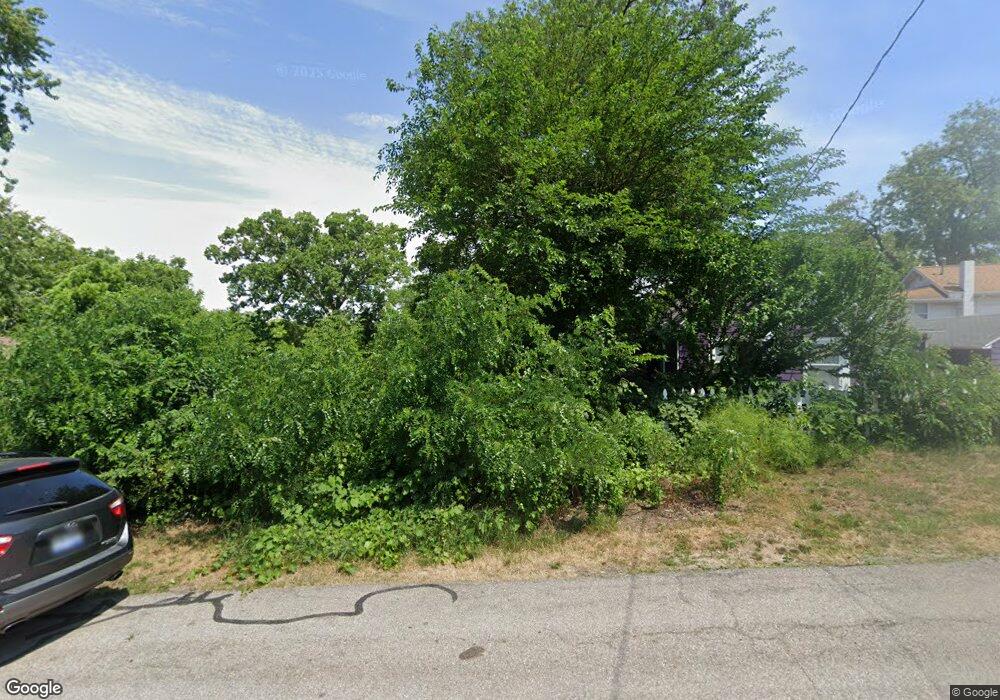
509 Wright St NE Grand Rapids, MI 49505
Creston NeighborhoodEstimated Value: $140,055 - $225,000
Studio
--
Bath
--
Sq Ft
5,271
Sq Ft Lot
About This Home
This home is located at 509 Wright St NE, Grand Rapids, MI 49505 and is currently estimated at $197,014. 509 Wright St NE is a home with nearby schools including Riverside Middle School, Union High School, and ISJ Academy.
Ownership History
Date
Name
Owned For
Owner Type
Purchase Details
Closed on
Jul 31, 2024
Sold by
Johnson Amanda
Bought by
Engle Andrew and Engle Lorissa
Current Estimated Value
Purchase Details
Closed on
Jan 19, 2022
Sold by
Beeke Investments Llc
Bought by
Johnson Amanda
Purchase Details
Closed on
Jul 16, 2021
Sold by
Secor Crystal
Bought by
Beeke Investments Llc
Purchase Details
Closed on
Nov 26, 2018
Sold by
Secor Jared and Secor Crystal
Bought by
Secor Crystal
Purchase Details
Closed on
Aug 24, 2016
Sold by
Jensen Theodore W and Jensen Susan
Bought by
Secor Jared and Secor Crystal
Home Financials for this Owner
Home Financials are based on the most recent Mortgage that was taken out on this home.
Original Mortgage
$87,878
Interest Rate
3.42%
Mortgage Type
FHA
Purchase Details
Closed on
Nov 7, 1997
Sold by
Vnckr Vnckr R R and Vnckr M
Bought by
Dghty Dghty W and Dghty C
Purchase Details
Closed on
Feb 22, 1993
Purchase Details
Closed on
Jun 17, 1983
Purchase Details
Closed on
Jun 6, 1983
Purchase Details
Closed on
May 31, 1983
Create a Home Valuation Report for This Property
The Home Valuation Report is an in-depth analysis detailing your home's value as well as a comparison with similar homes in the area
Home Values in the Area
Average Home Value in this Area
Purchase History
| Date | Buyer | Sale Price | Title Company |
|---|---|---|---|
| Engle Andrew | $245,000 | Chicago Title | |
| Johnson Amanda | $227,000 | Irongate Title Agency | |
| Beeke Investments Llc | $130,000 | Irongate Title Agency Llc | |
| Secor Crystal | $7,500 | Amrock Inc | |
| Secor Jared | $89,500 | Sun Title Agency Of Mi Llc | |
| Dghty Dghty W | $50,000 | -- | |
| -- | $27,700 | -- | |
| -- | $11,000 | -- | |
| -- | $12,900 | -- | |
| -- | $8,000 | -- |
Source: Public Records
Mortgage History
| Date | Status | Borrower | Loan Amount |
|---|---|---|---|
| Previous Owner | Secor Jared | $87,878 |
Source: Public Records
Tax History
| Year | Tax Paid | Tax Assessment Tax Assessment Total Assessment is a certain percentage of the fair market value that is determined by local assessors to be the total taxable value of land and additions on the property. | Land | Improvement |
|---|---|---|---|---|
| 2025 | $592 | $18,300 | $0 | $0 |
| 2024 | $6 | $14,900 | $0 | $0 |
| 2023 | $566 | $11,300 | $0 | $0 |
| 2022 | $570 | $11,000 | $0 | $0 |
| 2021 | $423 | $10,000 | $0 | $0 |
| 2020 | $408 | $9,500 | $0 | $0 |
| 2019 | $418 | $8,600 | $0 | $0 |
| 2018 | $406 | $8,300 | $0 | $0 |
| 2017 | $448 | $7,400 | $0 | $0 |
| 2016 | $320 | $7,400 | $0 | $0 |
| 2015 | $305 | $7,400 | $0 | $0 |
| 2013 | -- | $7,300 | $0 | $0 |
Source: Public Records
Map
Nearby Homes
- 2940 Coit Ave NE
- 536 Wright St NE
- 631 3 Mile Rd NE
- 2512 Union Ave NE
- 2509 Belknap Ave NE
- 937 Lamberton St NE
- 177 Boltwood Dr NE
- 160 Boltwood Dr NE
- 2836 Fuller Ave NE
- 3334 Rickman Ave NE
- 414 Cheshire Dr NE
- 483 Kenwood St NE
- 1313 Ellsmere St NE
- 3779 Willow Dr NE
- 2137 Eastern Ave NE
- 147 Montrose St NE
- 707 Graceland St NE
- 3776 Eastern Ave NE
- 1161 Dorroll St NE
- 408 Brady St NW
- 517 Wright St NE
- 501 Wright St NE
- 2963 Coit Ave NE
- 2965 Coit Ave NE
- 481 Wright St NE
- 2941 Coit Ave NE
- Lot 4 Coit Ave NE
- Lot 5 Coit Ave NE
- 4 Coit Ave NE
- 5 Coit Ave NE
- 5783 Coit Ave NE
- 4440 Coit Ave NE
- 5428 Coit Ave NE
- 5481 Coit Ave NE
- 504 Wright St NE
- 475 Wright St NE
- 480 Wright St NE
- 3019 Coit Ave NE
- 2946 Coit Ave NE
- 2932 Paris Ave NE
Your Personal Tour Guide
Ask me questions while you tour the home.