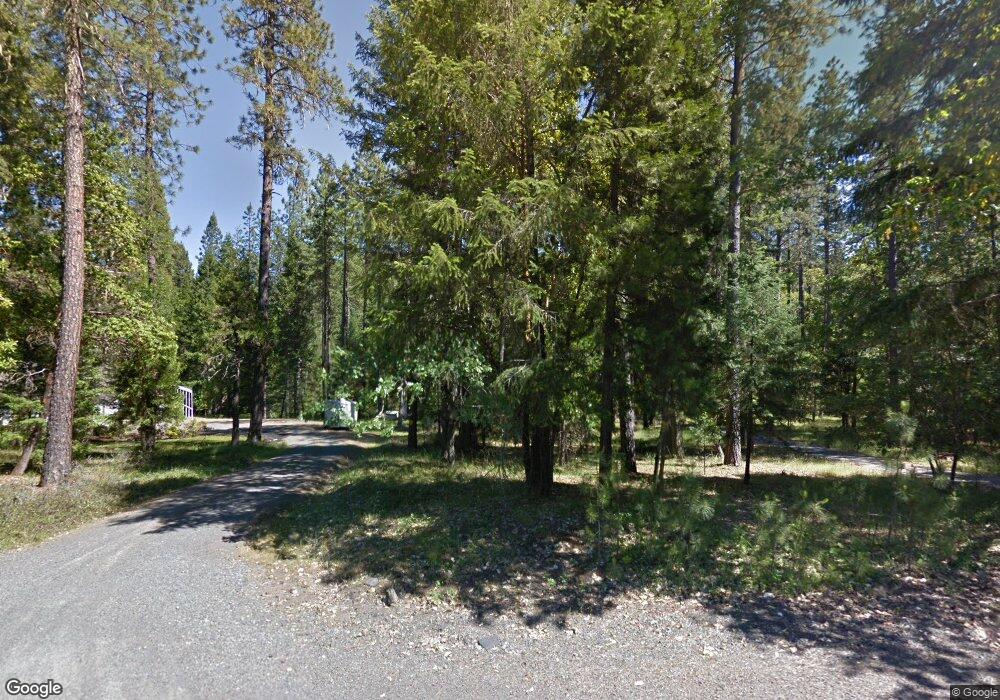
5090 Pleasant Creek Rd Rogue River, OR 97537
Estimated Value: $627,922 - $720,000
3
Beds
3
Baths
2,382
Sq Ft
$283/Sq Ft
Est. Value
About This Home
This home is located at 5090 Pleasant Creek Rd, Rogue River, OR 97537 and is currently estimated at $673,961, approximately $282 per square foot. 5090 Pleasant Creek Rd is a home located in Jackson County with nearby schools including Rogue River Elementary School, South Valley Academy, and Rogue River Junior/Senior High School.
Ownership History
Date
Name
Owned For
Owner Type
Purchase Details
Closed on
Jul 9, 2007
Sold by
Snider Candace
Bought by
Snider Candace R and Snider John W
Current Estimated Value
Purchase Details
Closed on
Jan 14, 1999
Sold by
Benson Daniel W and Benson Carolyn L
Bought by
Schaeffer Norm
Home Financials for this Owner
Home Financials are based on the most recent Mortgage that was taken out on this home.
Original Mortgage
$149,502
Outstanding Balance
$34,378
Interest Rate
6.66%
Mortgage Type
Construction
Estimated Equity
$639,583
Purchase Details
Closed on
May 22, 1998
Sold by
Snider Candace R
Bought by
Snider Candace
Home Financials for this Owner
Home Financials are based on the most recent Mortgage that was taken out on this home.
Original Mortgage
$118,600
Interest Rate
7.13%
Create a Home Valuation Report for This Property
The Home Valuation Report is an in-depth analysis detailing your home's value as well as a comparison with similar homes in the area
Home Values in the Area
Average Home Value in this Area
Purchase History
| Date | Buyer | Sale Price | Title Company |
|---|---|---|---|
| Snider Candace R | -- | None Available | |
| Schaeffer Norm | $55,000 | Key Title Company | |
| Snider Candace | -- | Oregon Title Insurance Co |
Source: Public Records
Mortgage History
| Date | Status | Borrower | Loan Amount |
|---|---|---|---|
| Open | Schaeffer Norm | $149,502 | |
| Previous Owner | Snider Candace | $118,600 |
Source: Public Records
Tax History Compared to Growth
Tax History
| Year | Tax Paid | Tax Assessment Tax Assessment Total Assessment is a certain percentage of the fair market value that is determined by local assessors to be the total taxable value of land and additions on the property. | Land | Improvement |
|---|---|---|---|---|
| 2025 | $3,078 | $307,470 | $123,600 | $183,870 |
| 2024 | $3,078 | $298,520 | $120,000 | $178,520 |
| 2023 | $2,976 | $289,830 | $116,500 | $173,330 |
| 2022 | $2,912 | $289,830 | $116,500 | $173,330 |
| 2021 | $2,827 | $281,390 | $113,100 | $168,290 |
| 2020 | $2,759 | $273,200 | $109,810 | $163,390 |
| 2019 | $2,691 | $257,530 | $103,500 | $154,030 |
| 2018 | $2,622 | $250,030 | $100,490 | $149,540 |
| 2017 | $2,561 | $250,030 | $100,490 | $149,540 |
| 2016 | $2,497 | $235,680 | $94,710 | $140,970 |
| 2015 | $2,419 | $235,680 | $94,710 | $140,970 |
| 2014 | $2,339 | $222,160 | $89,280 | $132,880 |
Source: Public Records
Map
Nearby Homes
- 4235 Pleasant Creek Rd
- 18515 Ditch Creek Rd
- 36510 Ditch Creek Rd
- 2016 Sykes Creek Rd
- 36435 Ditch Creek Rd Unit 204
- 1480 Sykes Creek Rd
- 1740 Pleasant Creek Rd
- 0 Sykes Cr Rd
- 9184 W Evans Creek Rd
- 8797 W Evans Creek Rd
- 8951 E Evans Creek Rd Unit 14
- 643 Covered Bridge Rd
- 9820 E Evans Creek Rd
- 149 Queens Branch Rd
- 0 Jump Creek Rd Unit 104823965
- 255 Queens Branch Rd
- 0 E Evans Creek Rd Unit 11568775
- 0 E Evans Creek Rd Unit 24656493
- 798 Covered Bridge Rd
- 12330 E Evans Creek Rd
- 5080 Pleasant Creek Rd
- 5150 Pleasant Creek Rd
- 5050 Pleasant Creek Rd
- 5063 Pleasant Creek Rd
- 5151 Pleasant Creek Rd
- 5151 Plsnt Creek
- 4918 Pleasant Creek Rd
- 5320 Pleasant Creek Rd
- 5191 Pleasant Creek Rd
- 5482 Pleasant Creek Rd
- 5320 Plsnt Creek
- 4646 Pleasant Creek Rd
- 4620 Pleasant Creek Rd
- 4620 Pleasant Cr Rd
- 4893 Pleasant Creek Rd
- 4891 Pleasant Creek Rd
- 5400 Pleasant Creek Rd
- 4600 Pleasant Creek Rd
- 4901 Plsnt Creek
- 4651 Pleasant Creek Rd