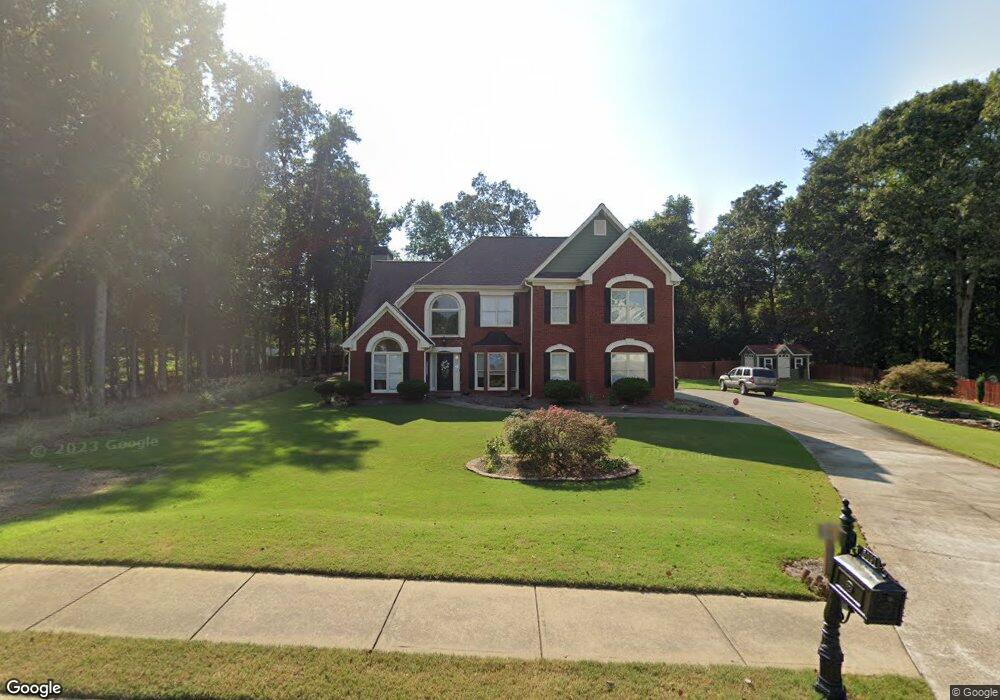
5091 Cabot Creek Dr Buford, GA 30518
Estimated Value: $598,000 - $656,000
4
Beds
3
Baths
2,617
Sq Ft
$237/Sq Ft
Est. Value
About This Home
This home is located at 5091 Cabot Creek Dr, Buford, GA 30518 and is currently estimated at $621,036, approximately $237 per square foot. 5091 Cabot Creek Dr is a home located in Gwinnett County with nearby schools including Level Creek Elementary School, North Gwinnett Middle School, and North Gwinnett High School.
Ownership History
Date
Name
Owned For
Owner Type
Purchase Details
Closed on
Sep 29, 2020
Sold by
Lopez Vanessa S
Bought by
Lopez Gloria and Lopez Victor H
Current Estimated Value
Purchase Details
Closed on
Jun 20, 2006
Sold by
Lopez Josefina R
Bought by
Cabbot Ents Llc
Purchase Details
Closed on
Mar 18, 2002
Sold by
Mattheis Michael V and Mattheis Stacey G
Bought by
Lopez Josefina R
Home Financials for this Owner
Home Financials are based on the most recent Mortgage that was taken out on this home.
Original Mortgage
$197,100
Interest Rate
9%
Mortgage Type
New Conventional
Create a Home Valuation Report for This Property
The Home Valuation Report is an in-depth analysis detailing your home's value as well as a comparison with similar homes in the area
Home Values in the Area
Average Home Value in this Area
Purchase History
| Date | Buyer | Sale Price | Title Company |
|---|---|---|---|
| Lopez Gloria | -- | -- | |
| Cabbot Ents Llc | $205,000 | -- | |
| Lopez Josefina R | $219,000 | -- |
Source: Public Records
Mortgage History
| Date | Status | Borrower | Loan Amount |
|---|---|---|---|
| Previous Owner | Lopez Josefina R | $197,100 |
Source: Public Records
Tax History Compared to Growth
Tax History
| Year | Tax Paid | Tax Assessment Tax Assessment Total Assessment is a certain percentage of the fair market value that is determined by local assessors to be the total taxable value of land and additions on the property. | Land | Improvement |
|---|---|---|---|---|
| 2024 | $1,730 | $208,280 | $46,000 | $162,280 |
| 2023 | $1,730 | $173,200 | $42,000 | $131,200 |
| 2022 | $1,687 | $173,200 | $42,000 | $131,200 |
| 2021 | $1,680 | $140,400 | $34,680 | $105,720 |
| 2020 | $1,544 | $140,400 | $34,680 | $105,720 |
| 2019 | $1,544 | $112,200 | $31,600 | $80,600 |
| 2018 | $1,526 | $112,200 | $31,600 | $80,600 |
| 2016 | $1,558 | $105,440 | $30,000 | $75,440 |
| 2015 | $1,598 | $105,440 | $30,000 | $75,440 |
| 2014 | -- | $97,120 | $24,400 | $72,720 |
Source: Public Records
Map
Nearby Homes
- 5047 Sara Creek Way Unit 2
- 4920 Puritan Dr Unit 1
- 5177 Cabot Creek Dr
- 5055 Puritan Dr
- 5040 Puritan Dr
- 159 Level Creek Rd
- 5008 Bethpage Dr
- 314 Level Creek Rd
- 280 Chandler Ct
- 623 Friars Head Ct
- 503 Glen Level Cir
- 5003 Pacific Dunes Dr
- 434 Level Creek Rd
- 425 Chandler Ct
- 4920 Markim Forest Ln
- 5006 Suwanee Dam Rd
- 5096 Akard Ct
- 502 Level Creek Rd
- 5087 Cabot Creek Dr
- 4925 Puritan Dr
- 4915 Puritan Dr
- 5096 Cabot Creek Dr
- 5077 Cabot Creek Dr
- 4935 Puritan Dr
- 5106 Cabot Creek Dr Unit 11
- 5106 Cabot Creek Dr
- 5105 Cabot Creek Dr
- 4945 Puritan Dr
- 404 Ambrose Creek Dr
- 5076 Cabot Creek Dr Unit 1
- 393 Ambrose Creek Dr
- 4895 Puritan Dr Unit 1
- 5086 Cabot Creek Dr
- 5111 Cabot Creek Dr
- 394 Ambrose Creek Dr Unit 13
- 383 Ambrose Creek Dr
- 5136 Cabot Creek Dr
- 4930 Puritan Dr Unit 1