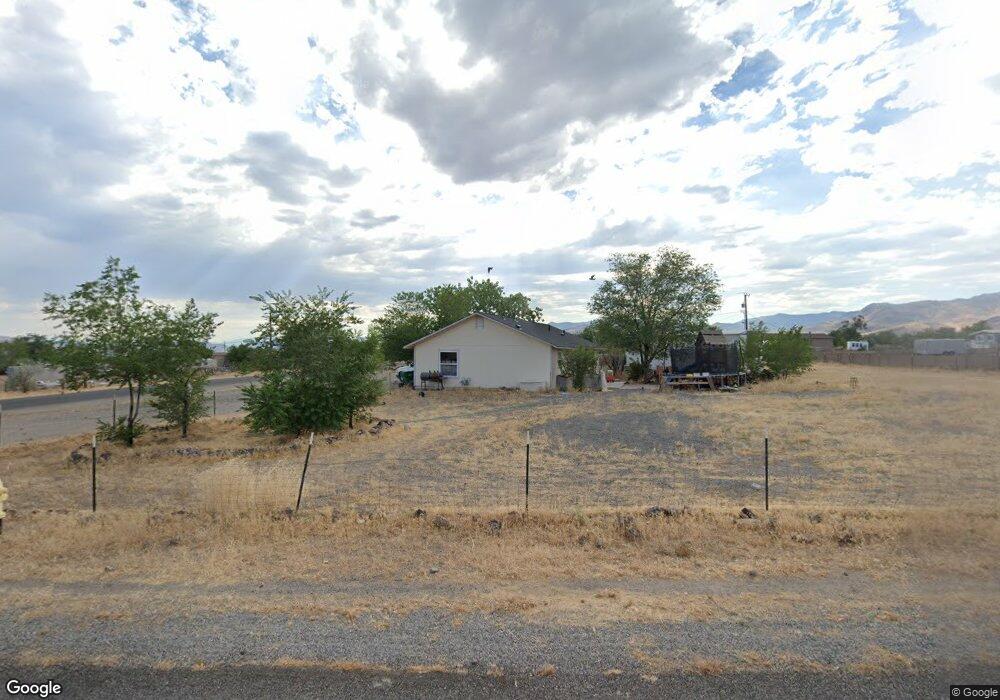
5095 Abilene Dr Unit 1 Silver Springs, NV 89429
Estimated Value: $219,000 - $342,663
3
Beds
2
Baths
1,344
Sq Ft
$209/Sq Ft
Est. Value
About This Home
This home is located at 5095 Abilene Dr Unit 1, Silver Springs, NV 89429 and is currently estimated at $280,916, approximately $209 per square foot. 5095 Abilene Dr Unit 1 is a home located in Lyon County with nearby schools including Silver Springs Elementary School and Silver Stage High School.
Ownership History
Date
Name
Owned For
Owner Type
Purchase Details
Closed on
Aug 16, 2022
Sold by
James And Barbara Johns Revocable Living
Bought by
Bezzone Natalie J
Current Estimated Value
Purchase Details
Closed on
Jul 10, 2013
Sold by
Johns Julia C
Bought by
Johns Mark J
Purchase Details
Closed on
May 20, 2013
Sold by
Johns Mark J and Johns Mark J
Bought by
Johns Mark J and Johns James R
Purchase Details
Closed on
Jan 19, 2011
Sold by
Krivich Dale Michael
Bought by
Johns Mark J and The James & Barbara Johns Revocable Livi
Purchase Details
Closed on
Sep 6, 2008
Sold by
Krivich Dale Michael
Bought by
Krivich Michael and Krivich Mark
Purchase Details
Closed on
Aug 15, 2007
Sold by
Vetsch Leonard and Vetsch Robert
Bought by
Krivich Dale Michael
Home Financials for this Owner
Home Financials are based on the most recent Mortgage that was taken out on this home.
Original Mortgage
$110,000
Interest Rate
6.74%
Mortgage Type
Purchase Money Mortgage
Create a Home Valuation Report for This Property
The Home Valuation Report is an in-depth analysis detailing your home's value as well as a comparison with similar homes in the area
Home Values in the Area
Average Home Value in this Area
Purchase History
| Date | Buyer | Sale Price | Title Company |
|---|---|---|---|
| Bezzone Natalie J | $85,000 | None Listed On Document | |
| Johns Mark J | -- | None Available | |
| Johns Mark J | -- | None Available | |
| Johns Mark J | $32,200 | None Available | |
| Krivich Michael | -- | None Available | |
| Krivich Dale Michael | $160,000 | Stewart Title Company |
Source: Public Records
Mortgage History
| Date | Status | Borrower | Loan Amount |
|---|---|---|---|
| Previous Owner | Krivich Dale Michael | $110,000 |
Source: Public Records
Tax History Compared to Growth
Tax History
| Year | Tax Paid | Tax Assessment Tax Assessment Total Assessment is a certain percentage of the fair market value that is determined by local assessors to be the total taxable value of land and additions on the property. | Land | Improvement |
|---|---|---|---|---|
| 2025 | $1,496 | $58,947 | $16,975 | $41,972 |
| 2024 | $1,394 | $59,243 | $16,975 | $42,267 |
| 2023 | $1,394 | $56,732 | $16,975 | $39,757 |
| 2022 | $1,092 | $54,559 | $16,975 | $37,584 |
| 2021 | $1,020 | $50,683 | $14,000 | $36,683 |
| 2020 | $953 | $48,620 | $14,000 | $34,620 |
| 2019 | $900 | $47,492 | $14,000 | $33,492 |
| 2018 | $863 | $41,403 | $8,750 | $32,653 |
| 2017 | $833 | $36,876 | $4,200 | $32,676 |
| 2016 | $815 | $22,051 | $4,200 | $17,851 |
| 2015 | $814 | $21,551 | $4,200 | $17,351 |
| 2014 | $795 | $20,601 | $6,160 | $14,441 |
Source: Public Records
Map
Nearby Homes
- 5225 Abilene Dr
- 5195 Pawnee Dr
- 7990 Abilene Dr
- 7815 Iroquois Trail
- 5220 Stagecoach Dr
- 4895 Cheyenne Trail
- 4795 Stagecoach Dr
- 8620 Iroquois Trail
- 5015 Washoe Cir
- 0 Stallion Springs Cir Unit 230001110
- 5575 Navajo Trail
- 5080 Arapahoe Ct
- 00 Mustang Trail
- 0000 Navajo Trail
- 9190 Navajo Trail
- 9185 Navajo Trail
- 8040 Rancho Ave
- 5990 Warpath Dr
- 9230 Santa fe Trail
- 9320 Pat Cir
- 5065 Abilene Dr
- 5080 Pawnee Dr
- 5105 Abilene Dr
- 5040 Pawnee Dr
- 5100 Pawnee Dr
- 7965 Cimarron Trail
- 5060 Abilene Dr
- 5035 Abilene Dr
- 5145 Abilene Dr
- 5000 Pawnee Dr
- 5030 Abilene Dr
- 5130 Pawnee Dr
- 5140 Abilene Dr Unit 1
- 5140 Abilene Dr
- 5095 Buffalo Dr
- 5105 Pawnee Dr
- 5045 Pawnee Dr Unit 3
- 5065 Buffalo Dr
- 5105 Buffalo Dr
- 5185 Abilene Dr