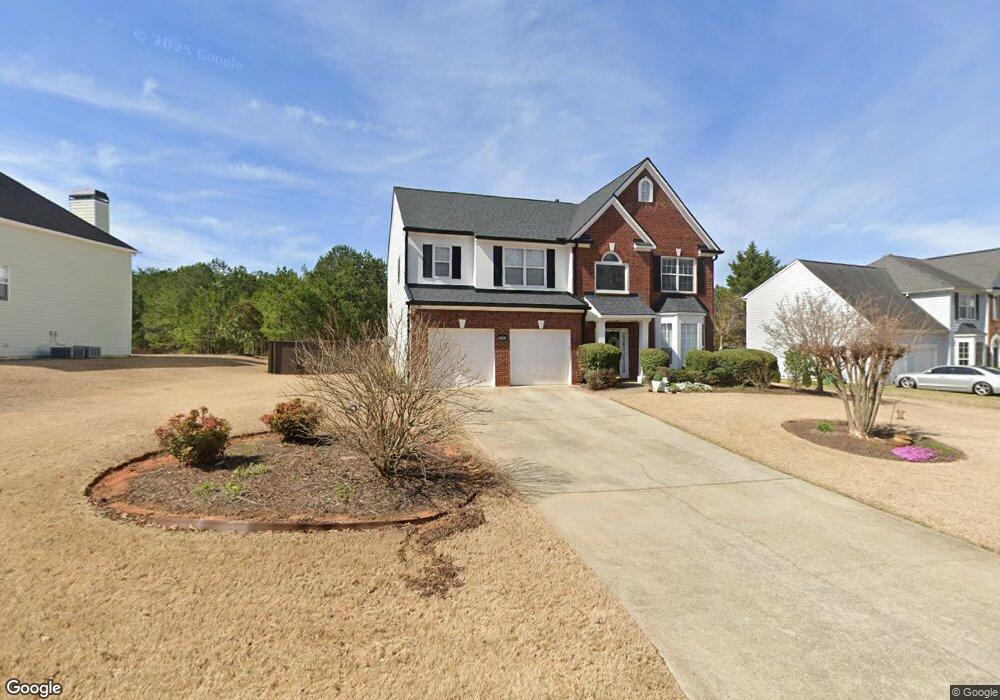
5096 Huntcrest Dr SW Unit 2 Mableton, GA 30126
Estimated Value: $392,000 - $444,000
4
Beds
3
Baths
2,914
Sq Ft
$144/Sq Ft
Est. Value
About This Home
This home is located at 5096 Huntcrest Dr SW Unit 2, Mableton, GA 30126 and is currently estimated at $418,544, approximately $143 per square foot. 5096 Huntcrest Dr SW Unit 2 is a home located in Cobb County with nearby schools including Deerwood Elementary School, Sunrise Elementary School, and Sanders Elementary School.
Ownership History
Date
Name
Owned For
Owner Type
Purchase Details
Closed on
Jan 30, 2021
Sold by
Walker Adrianne R and Walker Adrienne R
Bought by
Walker Adrianne R
Current Estimated Value
Home Financials for this Owner
Home Financials are based on the most recent Mortgage that was taken out on this home.
Original Mortgage
$184,200
Outstanding Balance
$164,080
Interest Rate
2.6%
Mortgage Type
New Conventional
Estimated Equity
$254,464
Purchase Details
Closed on
Apr 25, 2016
Sold by
Walker Larry
Bought by
Walker Adrienne
Purchase Details
Closed on
Jun 29, 2000
Sold by
D R Horton Inc
Bought by
Walker Larry G and Walker Adrienne R
Home Financials for this Owner
Home Financials are based on the most recent Mortgage that was taken out on this home.
Original Mortgage
$185,512
Interest Rate
8.54%
Mortgage Type
VA
Create a Home Valuation Report for This Property
The Home Valuation Report is an in-depth analysis detailing your home's value as well as a comparison with similar homes in the area
Home Values in the Area
Average Home Value in this Area
Purchase History
| Date | Buyer | Sale Price | Title Company |
|---|---|---|---|
| Walker Adrianne R | -- | None Available | |
| Walker Adrienne | -- | -- | |
| Walker Larry G | $181,900 | -- |
Source: Public Records
Mortgage History
| Date | Status | Borrower | Loan Amount |
|---|---|---|---|
| Open | Walker Adrianne R | $184,200 | |
| Previous Owner | Walker Larry G | $185,512 |
Source: Public Records
Tax History Compared to Growth
Tax History
| Year | Tax Paid | Tax Assessment Tax Assessment Total Assessment is a certain percentage of the fair market value that is determined by local assessors to be the total taxable value of land and additions on the property. | Land | Improvement |
|---|---|---|---|---|
| 2025 | $3,553 | $149,436 | $24,000 | $125,436 |
| 2024 | $3,556 | $149,436 | $24,000 | $125,436 |
| 2023 | $3,014 | $149,436 | $24,000 | $125,436 |
| 2022 | $2,727 | $110,292 | $16,000 | $94,292 |
| 2021 | $2,727 | $110,292 | $16,000 | $94,292 |
| 2020 | $2,410 | $95,800 | $16,000 | $79,800 |
| 2019 | $2,179 | $85,252 | $12,000 | $73,252 |
| 2018 | $2,179 | $85,252 | $12,000 | $73,252 |
| 2017 | $2,087 | $85,252 | $12,000 | $73,252 |
| 2016 | $1,749 | $69,840 | $12,000 | $57,840 |
| 2015 | $1,794 | $69,840 | $12,000 | $57,840 |
| 2014 | $1,545 | $60,832 | $0 | $0 |
Source: Public Records
Map
Nearby Homes
- 1675 Huntcrest Park SW
- 1645 Fulmont Cir
- 1440 Compton Dr SW
- Laurel Plan at Avenbrook
- Rosedale Plan at Avenbrook
- Fulmont at Avenbrook Plan at Avenbrook
- Addison Plan at Avenbrook
- Conley Plan at Avenbrook
- Bayberry Plan at Sawmill Creek - Bungalow Series
- Wisteria Plan at Sawmill Creek - Bungalow Series
- Redbud Plan at Sawmill Creek - Bungalow Series
- 1275 Clay Rd SW
- 0 Brookwood Dr Unit 7577066
- 0 Brookwood Dr Unit 10519191
- 5393 Janet Ln
- 4882 Golden Dr SW
- 5410 Beth Dr
- 5320 Beth Dr
- 5466 Davis Dr
- 1943 Arnold Dr
- 5092 Huntcrest Dr SW
- 5104 Huntcrest Dr SW Unit 2
- 5088 Huntcrest Dr SW Unit 1
- 5103 Huntcrest Dr SW
- 5099 Huntcrest Dr SW Unit 1
- 5112 Huntcrest Dr SW
- 5107 Huntcrest Dr SW
- 5095 Huntcrest Dr SW
- 5111 Huntcrest Dr SW
- 5091 Huntcrest Dr SW Unit 1
- 5084 Huntcrest Dr SW
- 5116 Huntcrest Dr SW
- 5115 Huntcrest Dr SW
- 1602 Huntcrest Walk SW
- 1602 Huntcrest Walk SW Unit 53
- 5076 Huntcrest Dr SW
- 5119 Huntcrest Dr SW
- 5120 Huntcrest Dr SW
- 5083 Huntcrest Dr SW
- 1606 Huntcrest Walk SW