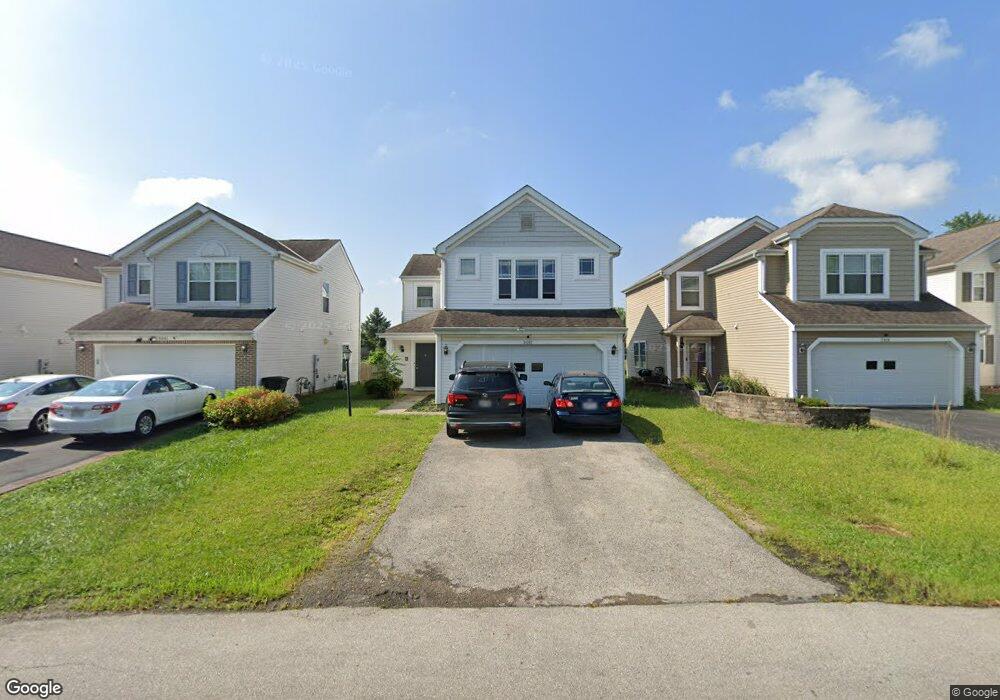
5097 Owen St Columbus, OH 43228
Cherry Creek NeighborhoodEstimated Value: $308,000 - $325,000
4
Beds
3
Baths
1,976
Sq Ft
$160/Sq Ft
Est. Value
About This Home
This home is located at 5097 Owen St, Columbus, OH 43228 and is currently estimated at $316,474, approximately $160 per square foot. 5097 Owen St is a home located in Franklin County with nearby schools including Prairie Norton Elementary School, Galloway Ridge Intermediate School, and Norton Middle School.
Ownership History
Date
Name
Owned For
Owner Type
Purchase Details
Closed on
Oct 9, 2020
Sold by
Volan Jeffrey D and Volan Amanda L
Bought by
Mohamed Abdulhamid Ahmed
Current Estimated Value
Home Financials for this Owner
Home Financials are based on the most recent Mortgage that was taken out on this home.
Original Mortgage
$194,750
Outstanding Balance
$172,904
Interest Rate
2.8%
Mortgage Type
New Conventional
Estimated Equity
$143,570
Purchase Details
Closed on
Jun 26, 2007
Sold by
M/I Homes Of Central Ohio Llc
Bought by
Volan Jeffrey D
Home Financials for this Owner
Home Financials are based on the most recent Mortgage that was taken out on this home.
Original Mortgage
$147,565
Interest Rate
6.42%
Mortgage Type
FHA
Purchase Details
Closed on
Dec 15, 2003
Sold by
M/I Schottenstein Homes Inc
Bought by
M/I Homes Of Central Ohio Llc
Create a Home Valuation Report for This Property
The Home Valuation Report is an in-depth analysis detailing your home's value as well as a comparison with similar homes in the area
Home Values in the Area
Average Home Value in this Area
Purchase History
| Date | Buyer | Sale Price | Title Company |
|---|---|---|---|
| Mohamed Abdulhamid Ahmed | $205,000 | Peak Title Agency | |
| Volan Jeffrey D | $148,900 | Transohio | |
| M/I Homes Of Central Ohio Llc | -- | Stewart Title Agency Of Colu |
Source: Public Records
Mortgage History
| Date | Status | Borrower | Loan Amount |
|---|---|---|---|
| Open | Mohamed Abdulhamid Ahmed | $194,750 | |
| Previous Owner | Volan Jeffrey D | $147,565 |
Source: Public Records
Tax History Compared to Growth
Tax History
| Year | Tax Paid | Tax Assessment Tax Assessment Total Assessment is a certain percentage of the fair market value that is determined by local assessors to be the total taxable value of land and additions on the property. | Land | Improvement |
|---|---|---|---|---|
| 2024 | $3,718 | $82,290 | $21,000 | $61,290 |
| 2023 | $3,542 | $82,290 | $21,000 | $61,290 |
| 2022 | $3,479 | $56,780 | $2,630 | $54,150 |
| 2021 | $3,881 | $56,780 | $2,630 | $54,150 |
| 2020 | $3,610 | $56,780 | $2,630 | $54,150 |
| 2019 | $3,336 | $45,820 | $2,100 | $43,720 |
| 2018 | $3,415 | $45,820 | $2,100 | $43,720 |
| 2017 | $3,119 | $45,820 | $2,100 | $43,720 |
| 2016 | $3,140 | $42,420 | $6,230 | $36,190 |
| 2015 | $3,140 | $42,420 | $6,230 | $36,190 |
| 2014 | $3,101 | $42,420 | $6,230 | $36,190 |
| 2013 | $1,819 | $49,875 | $7,315 | $42,560 |
Source: Public Records
Map
Nearby Homes
- 429 Postle Blvd
- 354 Fernhill Ave
- 40 Gladys Rd
- 264 Woodlawn Ave
- 435 Redmond Rd
- 5006 Old Tree Ave
- 110 Pasadena Ave
- 477 Clairbrook Ave
- 491 Clairbrook Ave Unit 3
- 417 Pamlico St Unit JK2
- 542 Clairbrook Ave Unit 11
- 452 Pamlico St Unit 9
- 515 Clairbrook Ave
- 4778 Hafey Ave
- 5409 Longworth Dr
- 5728 Greendale Dr
- 579 Simbury St Unit B9
- 299 Lombard Rd
- 488 Lombard Rd
- 5722 Silver Spurs Ln
- 5097 Owens St
- 5101 Owens St
- 5093 Owens St
- 5105 Owen St
- 5105 Owens St
- 5089 Owens St
- 5109 Owens St
- 5085 Owens St
- 5080 Maple Valley Dr
- 5079 Maple Valley Dr
- 5081 Owens St
- 5081 Owen St
- 5084 Maple Valley Dr
- 5077 Owen St
- 5083 Maple Valley Dr
- 5275 Owens St
- 5077 Owens St
- 297 Inah Ave
- 5087 Maple Valley Dr
- 5183 Baker Ridge Dr