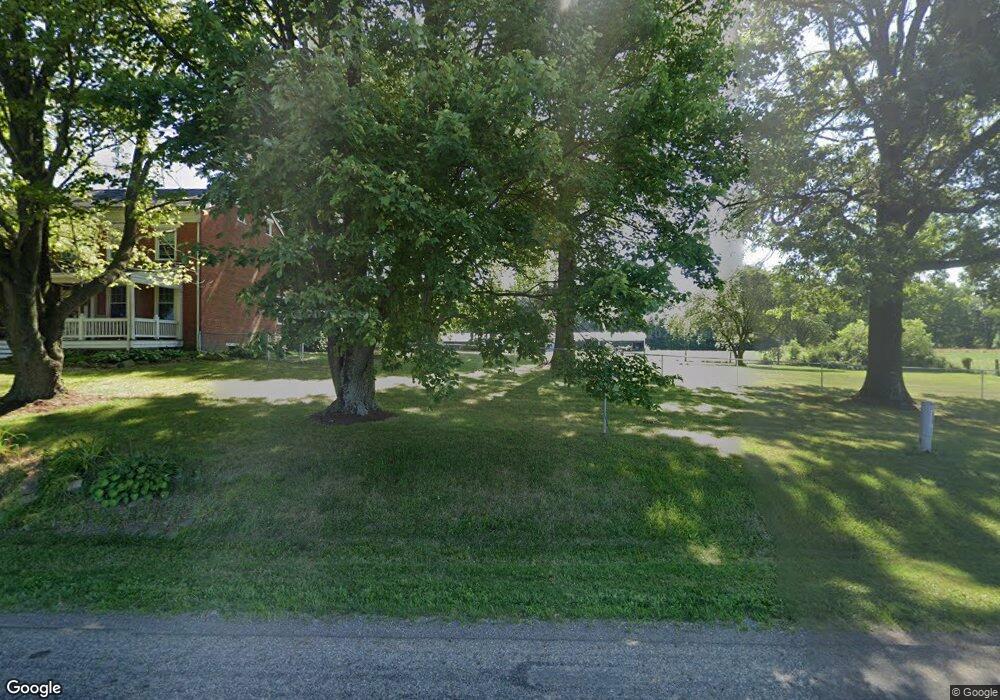
5098 S Honeytown Rd Wooster, OH 44691
Estimated Value: $466,000 - $871,688
4
Beds
2
Baths
2,400
Sq Ft
$281/Sq Ft
Est. Value
About This Home
This home is located at 5098 S Honeytown Rd, Wooster, OH 44691 and is currently estimated at $674,563, approximately $281 per square foot. 5098 S Honeytown Rd is a home located in Wayne County with nearby schools including Waynedale High School, Spring Hill, and Spring Run.
Ownership History
Date
Name
Owned For
Owner Type
Purchase Details
Closed on
Aug 29, 2020
Sold by
Davies Frederick H and Davies Kathleen G
Bought by
Johnson Polly Anne and Johnson Walter
Current Estimated Value
Purchase Details
Closed on
Aug 17, 2020
Sold by
Johnson Polly Anne and Johnson Walter
Bought by
Davies Frederick H and Davies Kathleen G
Purchase Details
Closed on
Feb 27, 2020
Sold by
Johnson Polly Ann and Johnson Polly Anne
Bought by
Johnson Polly Anne and Johnson Walter
Purchase Details
Closed on
Feb 20, 2020
Sold by
Davies Rees H
Bought by
Johnson Polly Anne and Johnson Walter
Purchase Details
Closed on
May 10, 2019
Sold by
Davies Frederick H
Bought by
Davies Frederick H and Johnson Polly Ann
Purchase Details
Closed on
Mar 13, 1991
Sold by
Davies Howell and Davies Pauline
Bought by
Davies Howell Trustee
Create a Home Valuation Report for This Property
The Home Valuation Report is an in-depth analysis detailing your home's value as well as a comparison with similar homes in the area
Home Values in the Area
Average Home Value in this Area
Purchase History
| Date | Buyer | Sale Price | Title Company |
|---|---|---|---|
| Johnson Polly Anne | -- | None Available | |
| Davies Frederick H | -- | None Available | |
| Johnson Polly Anne | -- | None Available | |
| Johnson Polly Anne | $50,000 | None Available | |
| Johnson Polly Anne | $50,000 | None Available | |
| Davies Frederick H | -- | None Available | |
| Davies Howell Trustee | -- | -- |
Source: Public Records
Tax History Compared to Growth
Tax History
| Year | Tax Paid | Tax Assessment Tax Assessment Total Assessment is a certain percentage of the fair market value that is determined by local assessors to be the total taxable value of land and additions on the property. | Land | Improvement |
|---|---|---|---|---|
| 2024 | $3,040 | $231,050 | $187,410 | $43,640 |
| 2023 | $3,040 | $231,050 | $187,410 | $43,640 |
| 2022 | $2,713 | $231,050 | $187,410 | $43,640 |
| 2021 | $2,718 | $231,050 | $187,410 | $43,640 |
| 2020 | $2,790 | $231,050 | $187,410 | $43,640 |
| 2019 | $4,046 | $228,120 | $195,300 | $32,820 |
| 2018 | $4,193 | $227,260 | $194,440 | $32,820 |
| 2017 | $4,201 | $227,260 | $194,440 | $32,820 |
| 2016 | $4,482 | $160,960 | $128,140 | $32,820 |
| 2015 | $4,159 | $160,960 | $128,140 | $32,820 |
| 2014 | $4,181 | $160,960 | $128,140 | $32,820 |
| 2013 | $3,134 | $103,420 | $73,030 | $30,390 |
Source: Public Records
Map
Nearby Homes
- 3433 Fredericksburg Rd
- 4622 S Apple Creek Rd
- 0 Nonpariel Rd
- 4554 E Moreland Rd
- 30 Grange St
- 250 Church St
- 0 E Main St
- 2477 Pleasant Ridge Rd
- 24 Shannon Dr
- 1993 Barnard Rd
- 0 E Moreland Rd
- 3306 Sylvan Rd
- 7445 Ely Rd
- 5277 Secrest Rd
- 3450 Secrest Rd
- 9554 Dover Rd
- 2530 Tuckahoe Rd
- 2599 Tuckahoe Rd
- 591 N Mill St Unit D
- 591 N Mill St Unit C
- 4969 S Honeytown Rd
- 4979 S Honeytown Rd
- 4975 S Honeytown Rd
- 4989 S Honeytown Rd
- 4647 E Messner Rd
- 5353 S Honeytown Rd
- 4985 S Honeytown Rd
- 5414 S Honeytown Rd
- 4655 E Messner Rd
- 4755 E Messner Rd
- 4775 E Messner Rd
- 4671 E Messner Rd
- 5405 S Honeytown Rd
- 4659 E Messner Rd
- 4788 S Honeytown Rd
- 4724 S Honeytown Rd
- 4189 E Messner Rd
- 5013 E Messner Rd
- 4607 E Messner Rd
- 4555 E Messner Rd