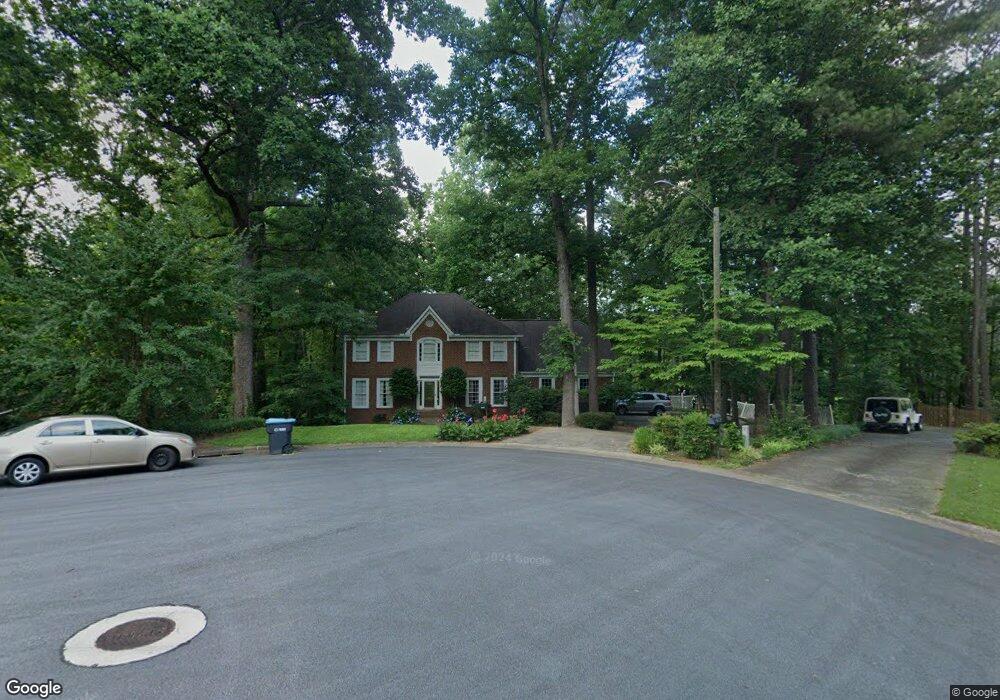
5099 Spring Rock Terrace NE Unit 1 Roswell, GA 30075
East Cobb NeighborhoodEstimated Value: $735,000 - $839,000
5
Beds
4
Baths
2,900
Sq Ft
$265/Sq Ft
Est. Value
About This Home
This home is located at 5099 Spring Rock Terrace NE Unit 1, Roswell, GA 30075 and is currently estimated at $767,130, approximately $264 per square foot. 5099 Spring Rock Terrace NE Unit 1 is a home located in Cobb County with nearby schools including Tritt Elementary School, Hightower Trail Middle School, and Pope High School.
Ownership History
Date
Name
Owned For
Owner Type
Purchase Details
Closed on
Jul 29, 1994
Sold by
Raines Doc M
Bought by
Brown Alan D Glenda H
Current Estimated Value
Home Financials for this Owner
Home Financials are based on the most recent Mortgage that was taken out on this home.
Original Mortgage
$200,250
Interest Rate
8.65%
Purchase Details
Closed on
Aug 16, 1993
Sold by
Mullen Richard
Bought by
Raines Doc M Barbara
Purchase Details
Closed on
May 17, 1993
Sold by
Dooley Kevin E Mary M
Bought by
Mullen Richard Aliss
Home Financials for this Owner
Home Financials are based on the most recent Mortgage that was taken out on this home.
Original Mortgage
$160,000
Interest Rate
4.12%
Create a Home Valuation Report for This Property
The Home Valuation Report is an in-depth analysis detailing your home's value as well as a comparison with similar homes in the area
Home Values in the Area
Average Home Value in this Area
Purchase History
| Date | Buyer | Sale Price | Title Company |
|---|---|---|---|
| Brown Alan D Glenda H | $222,500 | -- | |
| Raines Doc M Barbara | $211,500 | -- | |
| Mullen Richard Aliss | $207,000 | -- |
Source: Public Records
Mortgage History
| Date | Status | Borrower | Loan Amount |
|---|---|---|---|
| Closed | Brown Alan D Glenda H | $200,250 | |
| Previous Owner | Mullen Richard Aliss | $160,000 | |
| Closed | Raines Doc M Barbara | -- |
Source: Public Records
Tax History Compared to Growth
Tax History
| Year | Tax Paid | Tax Assessment Tax Assessment Total Assessment is a certain percentage of the fair market value that is determined by local assessors to be the total taxable value of land and additions on the property. | Land | Improvement |
|---|---|---|---|---|
| 2025 | $7,129 | $295,584 | $80,000 | $215,584 |
| 2024 | $6,787 | $279,516 | $64,000 | $215,516 |
| 2023 | $4,606 | $203,980 | $42,000 | $161,980 |
| 2022 | $5,187 | $203,980 | $42,000 | $161,980 |
| 2021 | $4,813 | $186,888 | $40,000 | $146,888 |
| 2020 | $4,813 | $186,888 | $40,000 | $146,888 |
| 2019 | $4,696 | $181,532 | $34,400 | $147,132 |
| 2018 | $4,696 | $181,532 | $34,400 | $147,132 |
| 2017 | $3,745 | $145,796 | $36,400 | $109,396 |
| 2016 | $3,749 | $145,796 | $36,400 | $109,396 |
| 2015 | $3,207 | $117,688 | $32,000 | $85,688 |
| 2014 | $3,234 | $117,688 | $0 | $0 |
Source: Public Records
Map
Nearby Homes
- 110 Boulder Dr
- 2696 Long Lake Terrace NE
- 2655 Boulder Creek Dr NE
- 2482 N Forest Dr
- 2661 Sandpoint Way NE
- 5250 Pikes Peak Ct
- 2859 Tynewick Dr NE
- 2779 Horseshoe Knoll Ln NE
- 4013 Lake Pointe Cir Unit 4013
- 3113 Lake Pointe Cir
- 2212 Heritage Trace View
- 2255 Rushmore Dr
- 3210 Lake Pointe Cir
- 2743 Chimney Springs Dr
- 1215 Ridgefield Dr
- 1009 Lake Pointe Cir
- 0 Spring Rock Terrace NE Unit 7403203
- 0 Spring Rock Terrace NE Unit 8791142
- 0 Spring Rock Terrace NE Unit 8754599
- 0 Spring Rock Terrace NE Unit 8422491
- 0 Spring Rock Terrace NE Unit 8184403
- 0 Spring Rock Terrace NE Unit 8629104
- 2650 Spring Rock Way NE
- 5100 Spring Rock Terrace NE
- 2656 Spring Rock Way NE
- 2670 Boulder Creek Dr NE
- 5098 Spring Rock Terrace NE
- 2674 Boulder Creek Dr NE
- 2660 Spring Rock Way NE
- 2666 Boulder Creek Dr NE Unit 1
- 0 Boulder Creek Dr Unit 3204552
- 0 Boulder Creek Dr Unit 3140777
- 0 Boulder Creek Dr Unit 8544795
- 0 Boulder Creek Dr Unit 8142079
- 0 Boulder Creek Dr Unit 8463264
- 0 Boulder Creek Dr Unit 7202965