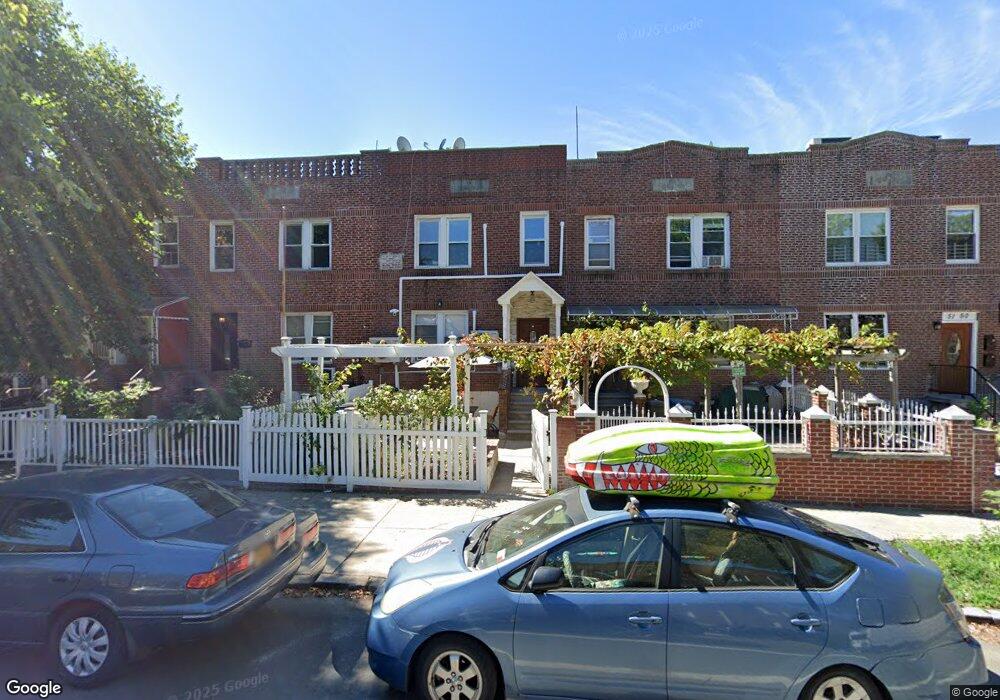
51-38 48th St Woodside, NY 11377
Maspeth NeighborhoodEstimated Value: $1,185,000 - $1,295,206
6
Beds
3
Baths
2,473
Sq Ft
$509/Sq Ft
Est. Value
About This Home
This home is located at 51-38 48th St, Woodside, NY 11377 and is currently estimated at $1,258,802, approximately $509 per square foot. 51-38 48th St is a home located in Queens County with nearby schools including P.S. 153 Maspeth, Grover Cleveland High School, and Razi School.
Ownership History
Date
Name
Owned For
Owner Type
Purchase Details
Closed on
Jan 16, 2015
Sold by
Tantawy Ashraf
Bought by
Wang Wei and Xu Xun
Current Estimated Value
Home Financials for this Owner
Home Financials are based on the most recent Mortgage that was taken out on this home.
Original Mortgage
$499,000
Outstanding Balance
$381,788
Interest Rate
3.81%
Mortgage Type
New Conventional
Estimated Equity
$877,014
Purchase Details
Closed on
Jun 14, 2000
Sold by
Doyle Patricia M
Bought by
Tantawy Ashraf
Home Financials for this Owner
Home Financials are based on the most recent Mortgage that was taken out on this home.
Original Mortgage
$319,500
Interest Rate
8.48%
Purchase Details
Closed on
Sep 8, 1997
Sold by
Doyle John J and Doyle Patricia M
Bought by
Doyle John J
Create a Home Valuation Report for This Property
The Home Valuation Report is an in-depth analysis detailing your home's value as well as a comparison with similar homes in the area
Home Values in the Area
Average Home Value in this Area
Purchase History
| Date | Buyer | Sale Price | Title Company |
|---|---|---|---|
| Wang Wei | $835,000 | -- | |
| Wang Wei | $835,000 | -- | |
| Tantawy Ashraf | $355,000 | -- | |
| Tantawy Ashraf | $355,000 | -- | |
| Doyle John J | -- | Commonwealth Land Title Ins | |
| Doyle John J | -- | Commonwealth Land Title Ins |
Source: Public Records
Mortgage History
| Date | Status | Borrower | Loan Amount |
|---|---|---|---|
| Open | Wang Wei | $499,000 | |
| Closed | Wang Wei | $499,000 | |
| Previous Owner | Tantawy Ashraf | $319,500 |
Source: Public Records
Tax History Compared to Growth
Tax History
| Year | Tax Paid | Tax Assessment Tax Assessment Total Assessment is a certain percentage of the fair market value that is determined by local assessors to be the total taxable value of land and additions on the property. | Land | Improvement |
|---|---|---|---|---|
| 2025 | $8,441 | $46,003 | $6,917 | $39,086 |
| 2024 | $8,453 | $43,424 | $6,132 | $37,292 |
| 2023 | $8,009 | $41,274 | $5,692 | $35,582 |
| 2022 | $7,953 | $79,440 | $10,980 | $68,460 |
| 2021 | $8,254 | $69,720 | $10,980 | $58,740 |
| 2020 | $7,819 | $59,940 | $10,980 | $48,960 |
| 2019 | $7,277 | $63,600 | $10,980 | $52,620 |
| 2018 | $7,195 | $34,395 | $6,263 | $28,132 |
| 2017 | $6,712 | $34,395 | $6,710 | $27,685 |
| 2016 | $6,458 | $34,395 | $6,710 | $27,685 |
| 2015 | -- | $31,947 | $8,390 | $23,557 |
Source: Public Records
Map
Nearby Homes
- 51-17 47th St Unit 2
- 50-56 47th St
- 50-43 48th St
- 50-05 46th St
- 5068 43rd St
- 48-41 45th St
- 48-50 44th St Unit 4E
- 48-56 44th St Unit 2H
- 48-55 43rd St Unit 4H
- 48-19 43rd St Unit 4D
- 4310 48th Ave Unit 2A
- 4310 48th Ave Unit 2F
- 43-10 48th Ave Unit 2A
- 43-10 48th Ave Unit 2P
- 43-10 48th Ave Unit . 2J
- 48-23 42nd St Unit 1 J
- 48-17 42nd St Unit 2C
- 48-17 42nd St Unit 7B
- 50-21 40th St
- 48-41 43rd St Unit 5F