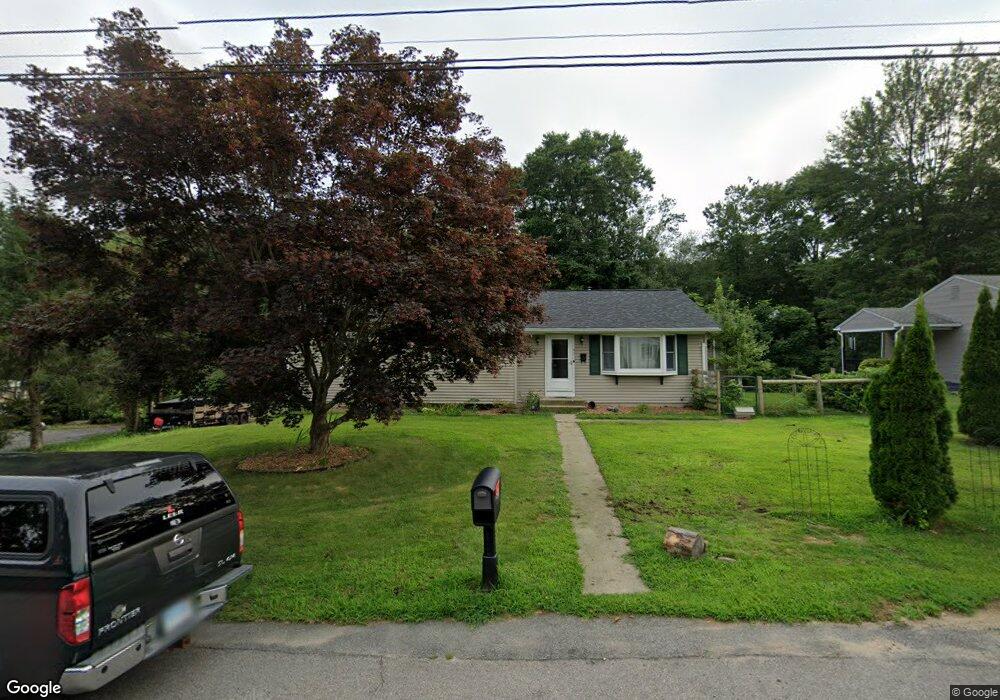
51 Adelaide St Danielson, CT 06239
Estimated Value: $311,000 - $343,610
3
Beds
2
Baths
1,228
Sq Ft
$270/Sq Ft
Est. Value
About This Home
This home is located at 51 Adelaide St, Danielson, CT 06239 and is currently estimated at $331,403, approximately $269 per square foot. 51 Adelaide St is a home located in Windham County with nearby schools including Killingly Central School, Killingly Memorial School, and Killingly Intermediate School.
Ownership History
Date
Name
Owned For
Owner Type
Purchase Details
Closed on
Aug 20, 2021
Sold by
Allard Vcolette M
Bought by
Stuba Shannon L and Stuba Michael
Current Estimated Value
Home Financials for this Owner
Home Financials are based on the most recent Mortgage that was taken out on this home.
Original Mortgage
$190,400
Outstanding Balance
$172,608
Interest Rate
2.7%
Mortgage Type
Stand Alone Refi Refinance Of Original Loan
Estimated Equity
$158,795
Purchase Details
Closed on
Dec 8, 1966
Bought by
Allard Colette M
Create a Home Valuation Report for This Property
The Home Valuation Report is an in-depth analysis detailing your home's value as well as a comparison with similar homes in the area
Home Values in the Area
Average Home Value in this Area
Purchase History
| Date | Buyer | Sale Price | Title Company |
|---|---|---|---|
| Stuba Shannon L | -- | None Available | |
| Stuba Shannon L | -- | None Available | |
| Stuba Shannon L | -- | None Available | |
| Allard Colette M | -- | -- |
Source: Public Records
Mortgage History
| Date | Status | Borrower | Loan Amount |
|---|---|---|---|
| Open | Stuba Shannon L | $190,400 | |
| Closed | Stuba Shannon L | $190,400 | |
| Previous Owner | Allard Colette M | $38,500 | |
| Previous Owner | Allard Colette M | $30,000 |
Source: Public Records
Map
Nearby Homes
Your Personal Tour Guide
Ask me questions while you tour the home.