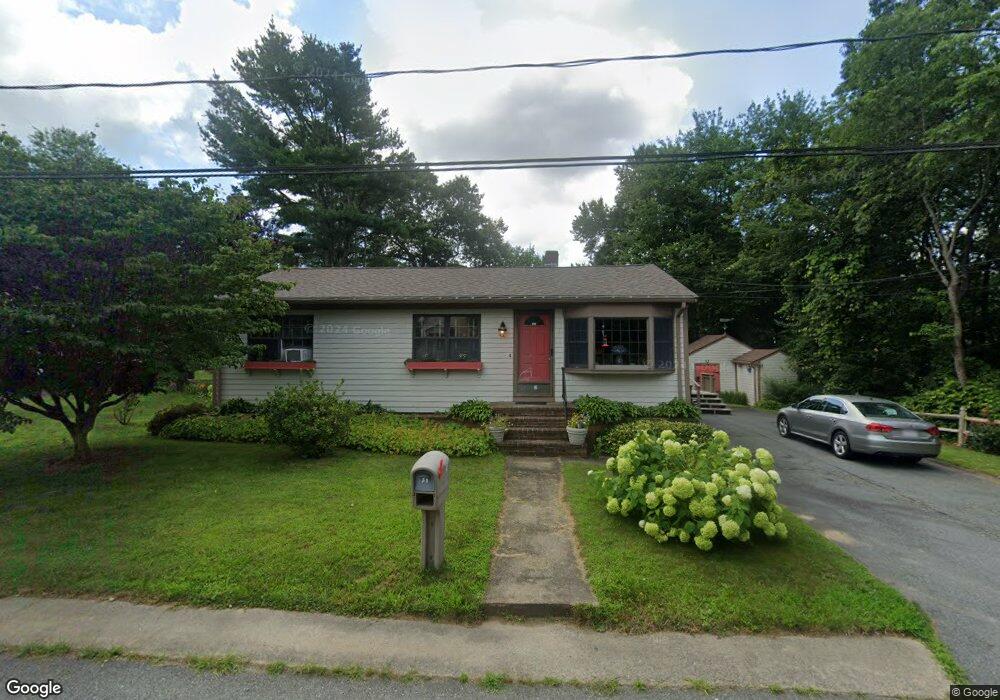
51 Allen St Acushnet, MA 02743
Upper Acushnet NeighborhoodEstimated Value: $402,000 - $449,000
2
Beds
1
Bath
1,200
Sq Ft
$353/Sq Ft
Est. Value
About This Home
This home is located at 51 Allen St, Acushnet, MA 02743 and is currently estimated at $423,627, approximately $353 per square foot. 51 Allen St is a home located in Bristol County with nearby schools including Acushnet Elementary School, Albert F Ford Middle School, and Alma Del Mar Charter School.
Ownership History
Date
Name
Owned For
Owner Type
Purchase Details
Closed on
Jul 21, 2015
Sold by
Stripinis Jean S
Bought by
Stripinis Ft and Stripinis
Current Estimated Value
Purchase Details
Closed on
May 31, 2002
Sold by
Sansoucy Rita B
Bought by
Stripinis Alvan B and Stripinis Jean S
Purchase Details
Closed on
Apr 20, 1994
Sold by
Santos David and Santos Linda M
Bought by
Durr Staceyk and Hodges David B
Home Financials for this Owner
Home Financials are based on the most recent Mortgage that was taken out on this home.
Original Mortgage
$85,900
Interest Rate
7.6%
Mortgage Type
Purchase Money Mortgage
Create a Home Valuation Report for This Property
The Home Valuation Report is an in-depth analysis detailing your home's value as well as a comparison with similar homes in the area
Home Values in the Area
Average Home Value in this Area
Purchase History
| Date | Buyer | Sale Price | Title Company |
|---|---|---|---|
| Stripinis Ft | -- | -- | |
| Stripinis Alvan B | $189,900 | -- | |
| Durr Staceyk | $90,500 | -- |
Source: Public Records
Mortgage History
| Date | Status | Borrower | Loan Amount |
|---|---|---|---|
| Previous Owner | Durr Staceyk | $59,000 | |
| Previous Owner | Durr Staceyk | $52,500 | |
| Previous Owner | Durr Staceyk | $85,900 |
Source: Public Records
Tax History
| Year | Tax Paid | Tax Assessment Tax Assessment Total Assessment is a certain percentage of the fair market value that is determined by local assessors to be the total taxable value of land and additions on the property. | Land | Improvement |
|---|---|---|---|---|
| 2025 | $36 | $329,200 | $91,100 | $238,100 |
| 2024 | $3,376 | $295,900 | $86,800 | $209,100 |
| 2023 | $3,260 | $271,700 | $78,400 | $193,300 |
| 2022 | $3,230 | $243,400 | $74,100 | $169,300 |
| 2021 | $3,094 | $223,700 | $74,100 | $149,600 |
| 2020 | $3,118 | $223,700 | $74,100 | $149,600 |
| 2019 | $2,913 | $205,400 | $65,700 | $139,700 |
| 2018 | $2,800 | $194,200 | $65,700 | $128,500 |
| 2017 | $2,689 | $186,200 | $65,700 | $120,500 |
| 2016 | $2,602 | $179,100 | $65,700 | $113,400 |
| 2015 | $2,458 | $172,100 | $65,700 | $106,400 |
Source: Public Records
Map
Nearby Homes
- 11 Boylston St
- 12 White St
- 12 Hayes St Unit 1
- 14 Hayes St Unit 1
- 23 Oliveira Ave
- 0 Hathaway Rd Unit 73469544
- 25 Pershing Ave
- 122 Truro St
- 27 Meadow Ln
- 81 Sylvia St
- 15 Ball St
- 34 Chicopee St
- 65 Armsby St
- 14 Caswell St
- 91 S Main St
- 7 Hamlin St
- 363 Main St
- 23 Coury Dr
- 1940-1942 Acushnet Ave
- 1077 Shelburne St
Your Personal Tour Guide
Ask me questions while you tour the home.