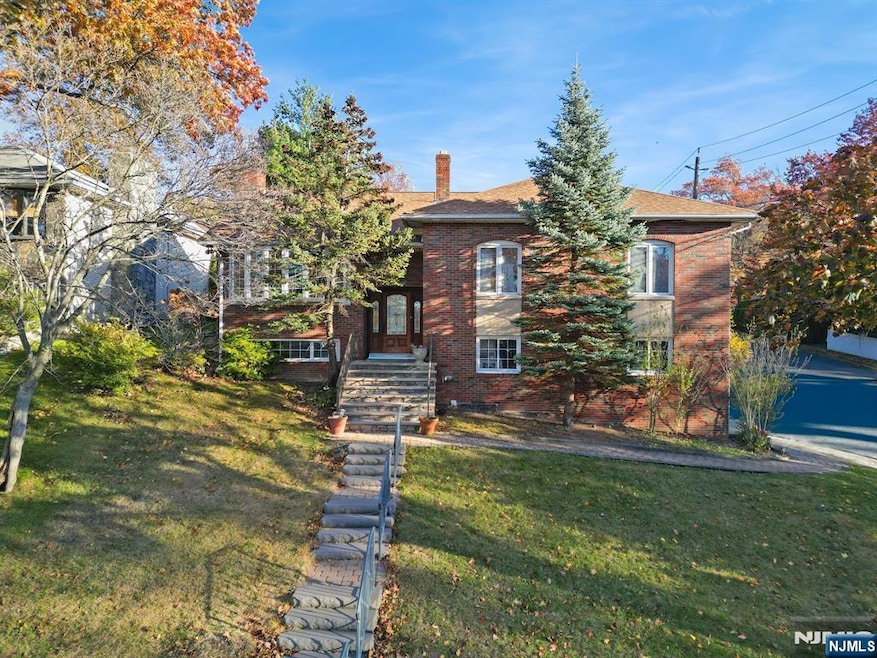
51 Anderson Ave Englewood Cliffs, NJ 07632
Estimated payment $8,293/month
Highlights
- Popular Property
- In Ground Pool
- Viking Appliances
- Upper School Elementary School Rated A
- Views to the North
- 4-minute walk to Veterans and Fallen Heroes Park
About This Home
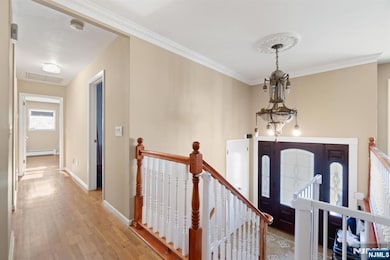
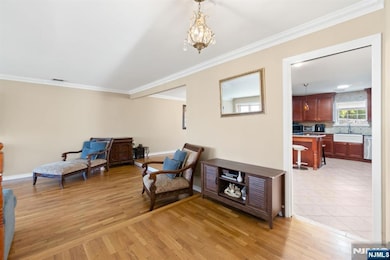
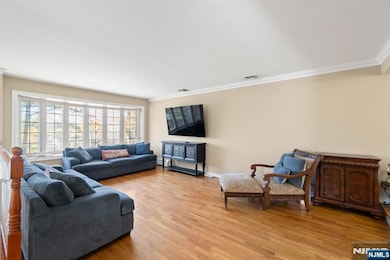
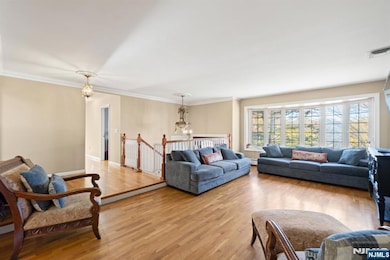
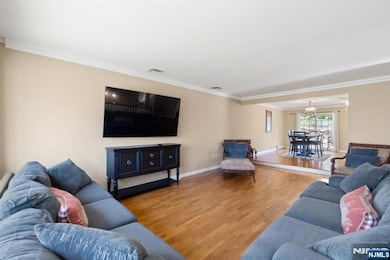
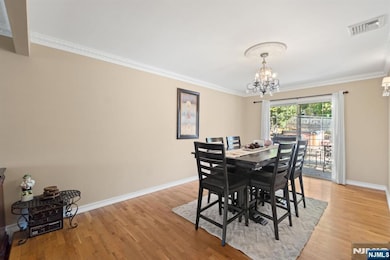
Welcome to this spacious, beautifully appointed bi-level home boasting over 2,800 square feet of comfortable living space and impressive curb appeal. The main level immediately captivates with gleaming hardwood floors throughout and an open living/dining room combination, brightly lit by a large bay window, creating an ideal setting for entertaining. The adjacent eat-in kitchen is a chef's delight, featuring granite countertops, a convenient breakfast bar, and high-end stainless steel appliances, including a coveted Viking stove, dishwasher, and French door refrigerator. Sliding glass doors from the dining room provide seamless access to the fenced backyard and the refreshing in-ground pool, promising endless outdoor enjoyment. The home offers five nicely sized bedrooms and 2.5 bathrooms, highlighted by the tranquil primary bedroom suite, which includes a luxurious ensuite complete with a soaking tub and separate stall shower. Additional features include central HVAC for year-round comfort and a spacious 2-car attached garage. This prime Englewood Cliffs location also offers an excellent commute to Manhattan, with easy access to the George Washington Bridge (GWB) and frequent NJ Transit bus service (such as the 186 line) on Sylvan Avenue/Route 9W, which provides a fast connection to either the GWB Bus Terminal/A-train subway or a direct route to the Port Authority Bus Terminal in Midtown. This property is the perfect blend of suburban luxury and commuter convenience.
Home Details
Home Type
- Single Family
Est. Annual Taxes
- $11,188
Lot Details
- 7,000 Sq Ft Lot
- Lot Dimensions are 70x100
- Rectangular Lot
Parking
- 2 Car Garage
Home Design
- Brick Exterior Construction
Bedrooms and Bathrooms
- 5 Bedrooms
- En-Suite Primary Bedroom
- Soaking Tub
Utilities
- Central Air
- Heating System Uses Natural Gas
Additional Features
- Views to the North
- Viking Appliances
- Basement Fills Entire Space Under The House
- Stairway
- In Ground Pool
Listing and Financial Details
- Legal Lot and Block 1 / 120
Map
Home Values in the Area
Average Home Value in this Area
Tax History
| Year | Tax Paid | Tax Assessment Tax Assessment Total Assessment is a certain percentage of the fair market value that is determined by local assessors to be the total taxable value of land and additions on the property. | Land | Improvement |
|---|---|---|---|---|
| 2025 | $11,188 | $968,700 | $585,000 | $383,700 |
| 2024 | $11,053 | $968,700 | $585,000 | $383,700 |
| 2023 | $10,879 | $968,700 | $585,000 | $383,700 |
| 2022 | $10,879 | $968,700 | $585,000 | $383,700 |
| 2021 | $8,362 | $968,700 | $585,000 | $383,700 |
| 2020 | $11,150 | $968,700 | $585,000 | $383,700 |
| 2019 | $10,472 | $968,700 | $585,000 | $383,700 |
| 2018 | $10,104 | $968,700 | $585,000 | $383,700 |
| 2017 | $9,668 | $968,700 | $585,000 | $383,700 |
| 2016 | $9,484 | $968,700 | $585,000 | $383,700 |
| 2015 | $9,009 | $968,700 | $585,000 | $383,700 |
| 2014 | $8,428 | $968,700 | $585,000 | $383,700 |
Property History
| Date | Event | Price | List to Sale | Price per Sq Ft |
|---|---|---|---|---|
| 11/13/2025 11/13/25 | For Sale | $1,398,000 | -- | -- |
Purchase History
| Date | Type | Sale Price | Title Company |
|---|---|---|---|
| Deed | $667,000 | -- |
Mortgage History
| Date | Status | Loan Amount | Loan Type |
|---|---|---|---|
| Open | $533,600 | No Value Available |
Source: New Jersey MLS
MLS Number: 25039625
APN: 16-00120-0000-00001
Disclaimer: Certain information contained herein is derived from information provided by parties other than Homes.com. All information provided is deemed reliable, but is not guaranteed to be accurate and should be independently verified.
![]() The data relating to the real estate for sale on this web site comes in part from the Internet Data Exchange Program of the NJMLS. Real estate listings held by brokerage firms other than Ten-X are marked with the Internet Data Exchange logo and information about them includes the name of the listing brokers. Some properties listed with the participating brokers do not appear on this website at the request of the seller. Listings of brokers that do not participate in Internet Data Exchange do not appear on this website.
The data relating to the real estate for sale on this web site comes in part from the Internet Data Exchange Program of the NJMLS. Real estate listings held by brokerage firms other than Ten-X are marked with the Internet Data Exchange logo and information about them includes the name of the listing brokers. Some properties listed with the participating brokers do not appear on this website at the request of the seller. Listings of brokers that do not participate in Internet Data Exchange do not appear on this website.
All information deemed reliable but not guaranteed. Source: New Jersey Multiple Listing, Inc.
© 2025 New Jersey Multiple Listing Service Inc. All rights reserved.
- 66 Elm St
- 184 Jenkins Dr
- 2460 1st St
- 54 Van Nostrand Ave
- 12 Summit St
- 26 Sara Hill Ln
- 2455 3rd St
- 505 Adele Ct
- 2446 3rd St
- 312 Bolz St
- 316 Bolz St
- 422 Myrtle Ave
- 424 Myrtle Ave
- 2410 3rd St
- 2445 6th St
- 485 Westview Place
- 470 Myrtle Ave
- 2468 7th St Unit B
- 2345 Linwood Ave Unit 4H
- 2345 Linwood Ave Unit LG
- 13 1st St
- 2449 1st St Unit 2
- 2417 Camner St Unit B
- 2440 3rd St
- 2416 Hammett Ave Unit A
- 2413 Hammett Ave Unit A
- 2413 Hammett Ave Unit B
- 2420 Rossett St Unit A
- 228B Washington Ave Unit B
- 2482 5th St Unit A
- 2450 Lemoine Ave Unit A
- 454 Westview Place
- 425 Grandview Place
- 2345 Linwood Ave Unit 6A
- 2345 Linwood Ave Unit 5D
- 2340 Linwood Ave Unit 2C
- 2400 Hudson Terrace Unit 6E
- 2301 Lemoine Ave Unit 606
- 2352 Linwood Ave Unit 4D
- 2352 Linwood Ave Unit 7G
