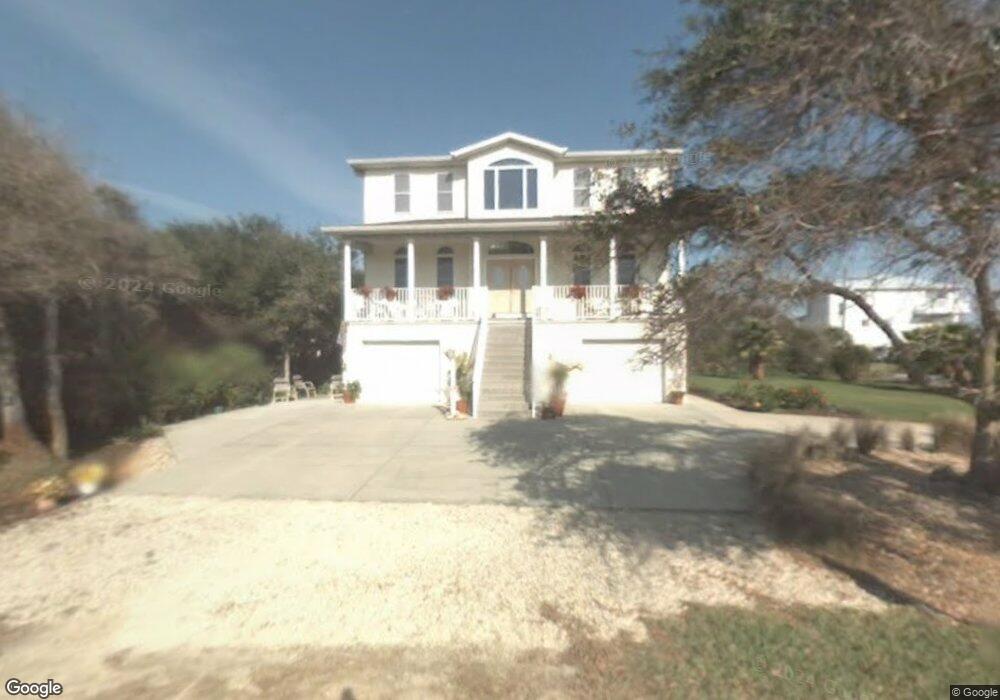
51 Atlantic Dr Palm Coast, FL 32137
Estimated Value: $819,000 - $1,073,000
--
Bed
3
Baths
2,808
Sq Ft
$340/Sq Ft
Est. Value
About This Home
This home is located at 51 Atlantic Dr, Palm Coast, FL 32137 and is currently estimated at $954,745, approximately $340 per square foot. 51 Atlantic Dr is a home located in Flagler County with nearby schools including Old Kings Elementary School, Indian Trails Middle School, and Matanzas High School.
Ownership History
Date
Name
Owned For
Owner Type
Purchase Details
Closed on
Apr 2, 2025
Sold by
Lamb Cynthia A
Bought by
Lamb Cynthia A and Lindsey Michelle Annette
Current Estimated Value
Purchase Details
Closed on
Dec 4, 1998
Sold by
Freedman James A and Freedman Patricia A
Bought by
Lamb David A and Lamb Cynthia A
Home Financials for this Owner
Home Financials are based on the most recent Mortgage that was taken out on this home.
Original Mortgage
$35,200
Interest Rate
6.9%
Create a Home Valuation Report for This Property
The Home Valuation Report is an in-depth analysis detailing your home's value as well as a comparison with similar homes in the area
Home Values in the Area
Average Home Value in this Area
Purchase History
| Date | Buyer | Sale Price | Title Company |
|---|---|---|---|
| Lamb Cynthia A | $100 | None Listed On Document | |
| Lamb Cynthia A | $100 | None Listed On Document | |
| Lamb David A | $47,000 | -- |
Source: Public Records
Mortgage History
| Date | Status | Borrower | Loan Amount |
|---|---|---|---|
| Previous Owner | Lamb David A | $35,200 |
Source: Public Records
Tax History Compared to Growth
Tax History
| Year | Tax Paid | Tax Assessment Tax Assessment Total Assessment is a certain percentage of the fair market value that is determined by local assessors to be the total taxable value of land and additions on the property. | Land | Improvement |
|---|---|---|---|---|
| 2024 | $4,859 | $333,064 | -- | -- |
| 2023 | $4,859 | $323,363 | $0 | $0 |
| 2022 | $4,637 | $313,945 | $0 | $0 |
| 2021 | $4,561 | $304,801 | $0 | $0 |
| 2020 | $4,558 | $300,593 | $0 | $0 |
| 2019 | $4,513 | $293,835 | $0 | $0 |
| 2018 | $4,521 | $288,356 | $0 | $0 |
| 2017 | $4,472 | $282,425 | $0 | $0 |
| 2016 | $4,436 | $276,616 | $0 | $0 |
| 2015 | $3,981 | $274,693 | $0 | $0 |
| 2014 | $4,012 | $272,513 | $0 | $0 |
Source: Public Records
Map
Nearby Homes