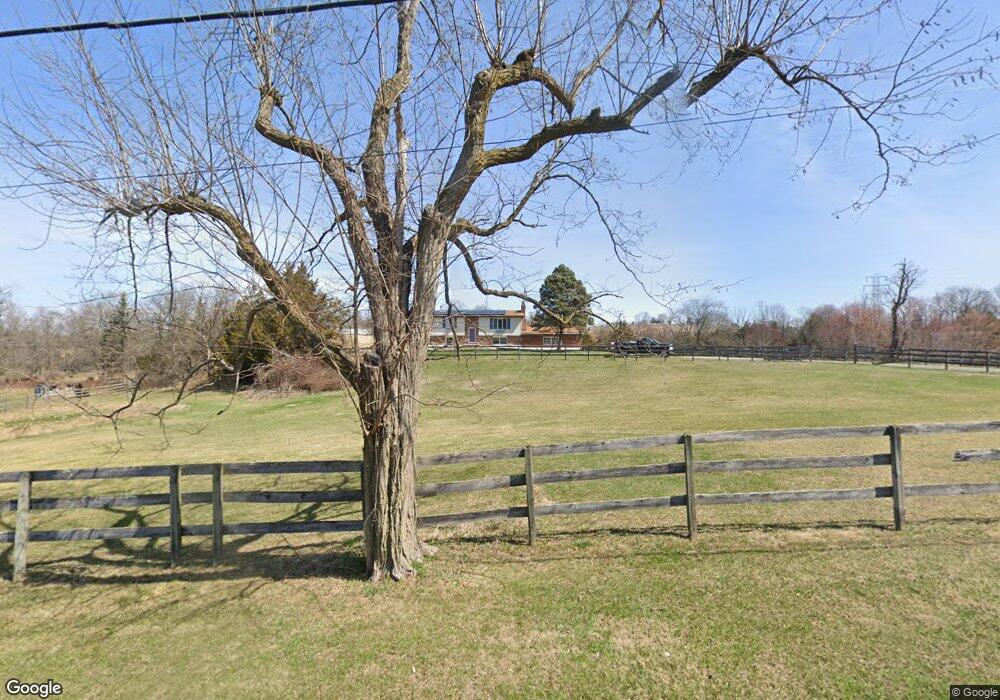
51 Belcher Rd Warwick, NY 10990
Estimated Value: $675,349 - $718,000
3
Beds
3
Baths
2,640
Sq Ft
$264/Sq Ft
Est. Value
About This Home
This home is located at 51 Belcher Rd, Warwick, NY 10990 and is currently estimated at $697,087, approximately $264 per square foot. 51 Belcher Rd is a home located in Orange County with nearby schools including Warwick Valley Middle School and Warwick Valley High School.
Ownership History
Date
Name
Owned For
Owner Type
Purchase Details
Closed on
Mar 24, 2017
Sold by
Edwards David
Bought by
Tierney Colleen M
Current Estimated Value
Home Financials for this Owner
Home Financials are based on the most recent Mortgage that was taken out on this home.
Original Mortgage
$321,100
Interest Rate
4.16%
Mortgage Type
Purchase Money Mortgage
Purchase Details
Closed on
Nov 19, 2004
Sold by
Pallas Deborah
Bought by
Edwards David and Edwards Julie
Create a Home Valuation Report for This Property
The Home Valuation Report is an in-depth analysis detailing your home's value as well as a comparison with similar homes in the area
Home Values in the Area
Average Home Value in this Area
Purchase History
| Date | Buyer | Sale Price | Title Company |
|---|---|---|---|
| Tierney Colleen M | $338,000 | Robert F. Mcmanus | |
| Edwards David | $415,000 | Robert Mcmanus |
Source: Public Records
Mortgage History
| Date | Status | Borrower | Loan Amount |
|---|---|---|---|
| Previous Owner | Tierney Colleen M | $321,100 |
Source: Public Records
Tax History Compared to Growth
Tax History
| Year | Tax Paid | Tax Assessment Tax Assessment Total Assessment is a certain percentage of the fair market value that is determined by local assessors to be the total taxable value of land and additions on the property. | Land | Improvement |
|---|---|---|---|---|
| 2024 | $9,435 | $41,700 | $17,000 | $24,700 |
| 2023 | $9,435 | $41,700 | $17,000 | $24,700 |
| 2022 | $9,263 | $41,700 | $17,000 | $24,700 |
| 2021 | $9,398 | $41,700 | $17,000 | $24,700 |
| 2020 | $9,357 | $41,700 | $17,000 | $24,700 |
| 2019 | $8,999 | $41,700 | $17,000 | $24,700 |
| 2018 | $8,999 | $41,700 | $17,000 | $24,700 |
| 2017 | $8,804 | $41,700 | $17,000 | $24,700 |
| 2016 | $8,639 | $41,700 | $17,000 | $24,700 |
| 2015 | -- | $41,700 | $17,000 | $24,700 |
| 2014 | -- | $41,700 | $17,000 | $24,700 |
Source: Public Records
Map
Nearby Homes