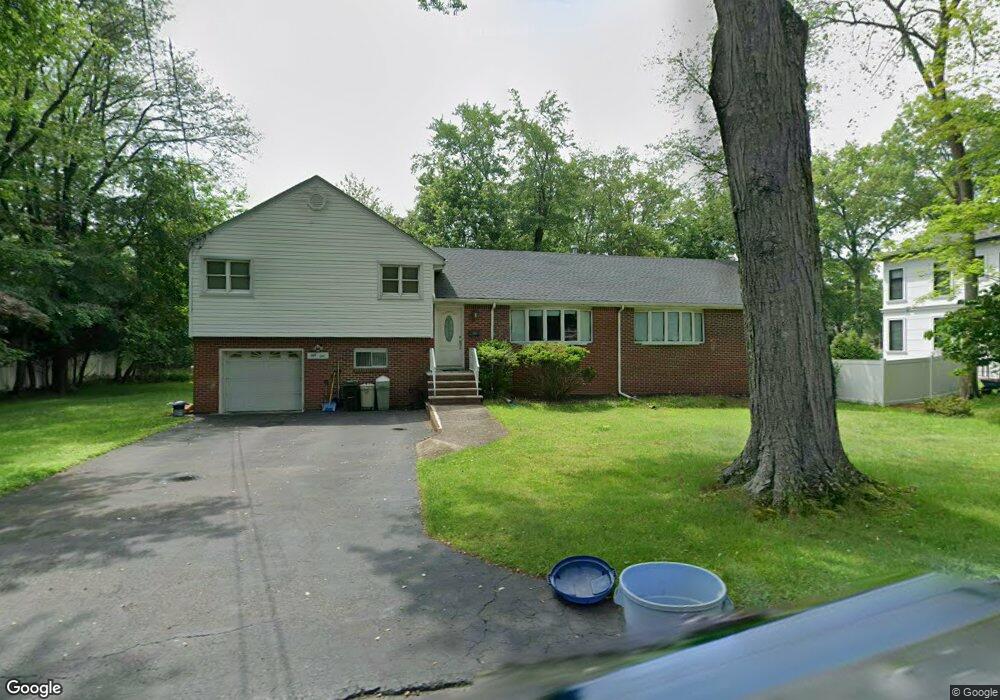
51 Belmar St Demarest, NJ 07627
Estimated Value: $948,871 - $1,186,000
Studio
--
Bath
1,752
Sq Ft
$586/Sq Ft
Est. Value
About This Home
This home is located at 51 Belmar St, Demarest, NJ 07627 and is currently estimated at $1,027,468, approximately $586 per square foot. 51 Belmar St is a home located in Bergen County with nearby schools including County Road Elementary School, Luther Lee Emerson Elementary School, and Demarest Middle School.
Ownership History
Date
Name
Owned For
Owner Type
Purchase Details
Closed on
Jul 28, 2004
Sold by
Falato Kathleen
Bought by
Jeong Ho Yong and Jeong Eun Kyoung
Current Estimated Value
Home Financials for this Owner
Home Financials are based on the most recent Mortgage that was taken out on this home.
Original Mortgage
$330,000
Interest Rate
5.89%
Create a Home Valuation Report for This Property
The Home Valuation Report is an in-depth analysis detailing your home's value as well as a comparison with similar homes in the area
Home Values in the Area
Average Home Value in this Area
Purchase History
| Date | Buyer | Sale Price | Title Company |
|---|---|---|---|
| Jeong Ho Yong | $499,000 | -- |
Source: Public Records
Mortgage History
| Date | Status | Borrower | Loan Amount |
|---|---|---|---|
| Previous Owner | Jeong Ho Yong | $330,000 |
Source: Public Records
Tax History
| Year | Tax Paid | Tax Assessment Tax Assessment Total Assessment is a certain percentage of the fair market value that is determined by local assessors to be the total taxable value of land and additions on the property. | Land | Improvement |
|---|---|---|---|---|
| 2025 | $14,240 | $866,400 | $612,400 | $254,000 |
| 2024 | $13,592 | $465,800 | $331,200 | $134,600 |
| 2023 | $13,224 | $465,800 | $331,200 | $134,600 |
| 2022 | $13,224 | $465,800 | $331,200 | $134,600 |
| 2021 | $12,898 | $465,800 | $331,200 | $134,600 |
| 2020 | $12,595 | $465,800 | $331,200 | $134,600 |
| 2019 | $12,232 | $465,800 | $331,200 | $134,600 |
| 2018 | $11,855 | $465,800 | $331,200 | $134,600 |
| 2017 | $11,570 | $465,800 | $331,200 | $134,600 |
| 2016 | $11,389 | $465,800 | $331,200 | $134,600 |
| 2015 | $11,235 | $465,800 | $331,200 | $134,600 |
| 2014 | $10,993 | $465,800 | $331,200 | $134,600 |
Source: Public Records
Map
Nearby Homes
- 39 Drury Ln
- 31 Madison Ave
- 106 Prescott St
- 232 County Rd
- 589 Piermont Rd
- 22 Northwood Ave
- 41 Orchard Rd
- 3 Central Ave
- 7 Central Ave
- 44 Orchard Rd
- 65 Prospect Ave
- 11 Stone Bridge Ct
- 24 Stone Bridge Ct
- 2 Stone Bridge Ct
- 25 Maple Ave
- 226 Haworth Ave
- 40 County Rd
- 214 Durie Ave
- 44 Pine Terrace
- 4 Lindeman Ave
- 50 Columbus Rd
- 62 Hardenburgh Ave
- 57 Belmar St
- 48 Belmar St
- 52 Belmar St
- 44 Columbus Rd
- 56 Columbus Rd
- 56 Belmar St
- 44 Belmar St
- 58 Belmar St
- 11 Palisade Blvd
- 7 Palisade Blvd
- 47 Columbus Rd
- 51 Columbus Rd
- 61 Belmar St
- 3 Palisade Blvd
- 61 Hardenburgh Ave
- 62 Columbus Rd
- 52 Hardenburgh Ave
- 15 Palisade Blvd
Your Personal Tour Guide
Ask me questions while you tour the home.